Divided Government and the Market: Is "Gridlock Good"? What the 2026 Midterms Mean for Traders
Every election night, two things happen with total reliability. The country splits into people who are elated and people who are despairing, and a remarkable number of them immediately decide they now know what the stock market is going to do. The 2026 midterms, which by early counts handed Congress to the Democrats while leaving a Republican in the White House, are no exception. The airwaves are full of confident claims about what “divided government” means for your portfolio. So let’s do something less common than the confidence: look at what the evidence actually shows (all of it, including the parts that contradict each other) and then talk about the much bigger danger, which is not the government’s behavior but your own.
Key takeaways
- The 2026 midterms produced divided government: by early results, Democrats won both chambers of Congress while a Republican holds the White House.
- Wall Street’s reflex is “gridlock is good,” and some datasets support it. But the evidence is genuinely mixed, and the strongest academic study (152 years) finds the opposite.
- Which means the real finding is humbling: the political configuration explains only a small, noisy slice of returns, swamped by the economy, the Fed and valuations.
- The bigger risk isn’t the policy. It’s you, trading your politics. Partisans get more bullish when their side wins and more bearish when it loses, and it costs them.
What actually happened
First, the facts, stated plainly and without spin. In the November 2026 midterm elections, early and unofficial results showed the Democratic Party winning majorities in both the House and the Senate, while President Trump, a Republican, remained in office. That configuration (one party controlling Congress, the other controlling the presidency) is what political scientists call divided government, and it is the norm more often than not in modern American history. The practical consequence that markets care about is simple: with the two branches held by opposing parties, major new legislation becomes much harder to pass. The agenda slows. This is the “gridlock” everyone is talking about. The question is whether gridlock is actually good for stocks, and here the tidy story falls apart.
The case for “gridlock is good”
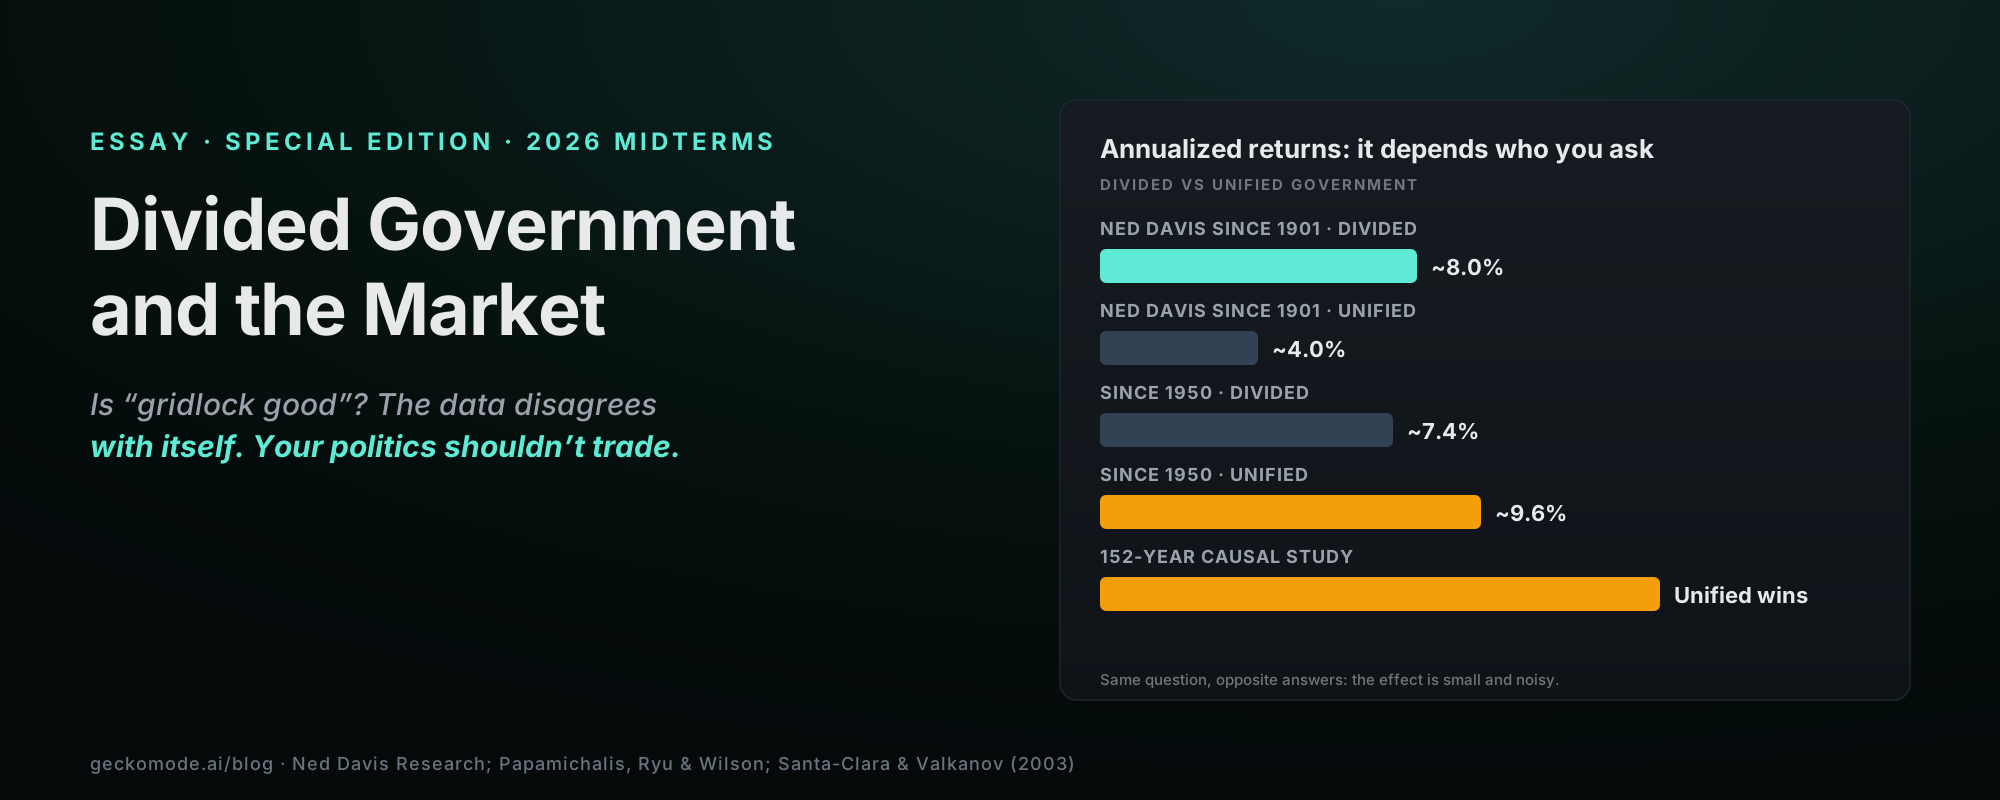
The popular view has real support, which is why it’s popular. The logic is intuitive: markets hate uncertainty, and a government that can’t pass sweeping new laws can’t surprise investors with dramatic policy changes, tax overhauls or regulatory upheavals. Stability, even the stability of paralysis, lets businesses plan. And some of the data backs it up: figures from Ned Davis Research going back to 1901 have shown the market returning roughly 8% annualized under divided government versus about 4% under unified control. Taken at face value, that’s a striking endorsement of gridlock, and it’s the number you’ll hear quoted most on election night, because it makes for a clean, reassuring story.
The case against it
Now the part the reassuring segments leave out. Slice the data differently and the conclusion flips. Analyses running since 1950 have found unified government outperforming divided: one showing roughly 9.6% annualized under unified versus 7.4% under divided, another roughly 14% versus 10%. More importantly, the most methodologically serious work points the same way. A recent academic study by Papamichalis, Ryu and Wilson, using 152 years of data and exploiting closely contested elections to get at causation rather than mere correlation, concludes that the US stock market earns substantially higher excess returns and the economy grows faster under unified government, precisely because a government able to act can respond to problems that gridlock leaves to fester. On this reading, “gridlock is good” has the story exactly backwards: the lowered policy risk comes at the cost of lowered policy responsiveness.
So which is it? The honest answer is that it depends entirely on your sample period, your index, and how you define “divided,” and when a result depends that heavily on arbitrary choices, the most likely truth is that the real effect is small, and most of what looks like a pattern is noise. That’s not a satisfying election-night soundbite. It’s just what the data actually supports.
| Source / period | Divided gov’t | Unified gov’t | Verdict |
|---|---|---|---|
| Ned Davis (since 1901) | ~8.0% | ~4.0% | Gridlock good |
| Analysis since 1950 | ~7.4% | ~9.6% | Unified better |
| Another cut (total return) | ~10.2% | ~14.1% | Unified better |
| Papamichalis et al. (152 yrs, causal) | Unified earns higher excess returns | Unified better | |
The “presidential puzzle”: interesting, not actionable
While we’re dismantling tidy political-market stories, here’s one more that gets quoted a lot. In a well-known 2003 paper, “The Presidential Puzzle,” Pedro Santa-Clara and Rossen Valkanov found that US stock excess returns were markedly higher under Democratic presidents than Republican ones, a gap too big to explain easily with risk or the business cycle. It’s a real and robust historical regularity, and partisans of both stripes love to weaponize it. But as a trading rule it’s close to useless: the sample is a handful of presidencies, the mechanism is genuinely unresolved, and the result tells you nothing reliable about any specific future four years. It’s a fascinating puzzle for financial economists. It is not a reason to reallocate your portfolio, and treating it as one is a good way to turn an academic curiosity into a personal loss.
What really drives returns (hint: it’s not the seating chart)
Step back and the whole debate shrinks to its proper size. Over any horizon that matters, stock returns are driven overwhelmingly by things that have little to do with which party holds which chamber: the path of the economy, corporate earnings, interest rates and the Fed (which we covered in the Warsh Fed piece), starting valuations (near historic highs, per our essay on tech bubbles), and the occasional genuine shock. The political configuration is a small input jostling among giants. There’s even a cheerful historical footnote: since 1974, the S&P 500 has averaged around 12% in the six months after a midterm, regardless of who won. But that likely has far more to do with the removal of pre-election uncertainty and the business cycle than with gridlock itself (we looked at that pattern in our midterms essay). The configuration is background noise. The economy is the signal.
The real danger: trading your politics
Here is where this becomes a Gecko essay rather than a political-science lecture, because the most important finding in this whole area isn’t about government at all. It’s about you. Behavioral research consistently shows that investors’ views of the market swing with their party’s fortunes: when your side is in power you become measurably more optimistic, take more risk, and expect higher returns; when your side loses you turn pessimistic and defensive. The market doesn’t change. Your perception of it does, driven by identity and emotion rather than fundamentals. And acting on that partisan swing degrades returns, because you end up buying and selling based on how an election made you feel.
This is the behavior gap wearing a political costume, and it’s especially dangerous because it doesn’t feel like an emotional error. It feels like analysis. “My side lost, so the market’s going to struggle” sounds like a thesis; it’s usually just despair with a ticker attached. The same is true in reverse: euphoria that your party won is not an edge. As with every loud, emotional macro event we’ve written about (geopolitical shocks, tariff headlines, Fed days), the disciplined move is to notice that your feelings have spiked and to not let them drive the trade.
From belief to behavior: are your politics in your P&L?
| The political-trading trap | The fingerprint in your trade history |
|---|---|
| Repositioning on the result | A burst of trades right after the election that reverse as the configuration turns out not to matter; worst expectancy around political events. |
| Partisan risk-on / risk-off | Size and exposure jumping up when your side wins, down when it loses: conviction tracking identity, not evidence. See size discipline. |
| “My side lost, sell” | Defensive selling after an unfavorable result, then missing the recovery: despair disguised as a thesis. |
| Overtrading the headlines | Activity rising with political news flow rather than setup quality; see overtrading. |
Partisan optimism and despair both leak into decisions, and both are measurable. Upload a broker statement and Gecko scores your event-day trading, sizing and overtrading in dollars across twelve behavioral axes, so you can see whether your politics are quietly in your P&L. No login or broker connection needed, first 100 trades free.
An educational tool, not financial advice.
Resources and further reading
- The causal study: Papamichalis, T., Ryu, D. & Wilson, M. I., “Divided Government and the Stock Market” (working paper): 152 years of data; unified government earns higher excess returns.
- The presidential puzzle: Santa-Clara, P. & Valkanov, R. (2003), “The Presidential Puzzle: Political Cycles and the Stock Market,” Journal of Finance 58(5): 1841–1872.
- The “gridlock” figures: Ned Davis Research data (via Mansharamani) and summaries from Stansberry and retirement-research analysts; note how sample period and index choice flip the result.
- Partisan perception: research on how investors’ market expectations and risk-taking move with their party’s electoral fortunes (e.g. work by Meeuwis, Parker, Schoar & Simester, and related studies).
- The behavioral companions: Gecko on headline-driven volatility and the Fed: the same “don’t trade your emotions” lesson in other arenas.
Frequently asked questions
Is divided government good for the stock market?
The evidence is genuinely mixed. “Gridlock is good” is supported by some datasets (Ned Davis since 1901 shows divided outperforming), but others since 1950 show unified outperforming, and the strongest academic study (152 years, causal) finds unified government produces higher excess returns. The result depends on sample period, index and definition, which means the real effect is small and noisy relative to the economy, the Fed and valuations.
What happened in the 2026 US midterms?
By early, unofficial results, Democrats won both the House and Senate while a Republican remained president: divided government. Final counts and certification were still pending, so seat totals may be revised.
Do markets do better under Republicans or Democrats?
Santa-Clara & Valkanov (2003) found excess returns markedly higher under Democratic presidents, “the presidential puzzle.” But it’s a historical regularity on a tiny sample with a debated mechanism, not a trading rule. Treating it as “buy under one party” is the kind of overconfident political trading the behavioral evidence warns against.
Should I change my investments based on the election?
History and behavioral research counsel caution. The configuration explains a small, noisy fraction of returns, and investors who trade on political feelings tend to do worse: they turn bullish when their party wins and bearish when it loses, distorting decisions. Keep your plan, size for volatility, and don’t let politics drive your trades.
Essay in Gecko’s trading psychology series, and explicitly non-partisan. Election results are early and unofficial as of early November 2026 and may be revised. Market figures are drawn from the cited studies and data providers (Papamichalis et al.; Santa-Clara & Valkanov 2003; Ned Davis Research and others); estimates vary widely by sample period and methodology, and nothing here is a market forecast. Gecko is an educational and informational tool. Nothing here is financial, investment or trading advice, or a political statement. Trading carries substantial risk of loss.
Drop in a single statement. Gecko produces a one-page Behavioral Diagnosis ranking your costliest habits in actual dollars. Free to start. No card. No broker connection.
Twelve checks, one per behavioral habit, that show what your own trading costs you. Then one behavioral self-check from the research, every other Friday.
No account needed. We only use your email for the newsletter, and every email has a one-click unsubscribe.
More on the blog
- The Art of Spending Money by Morgan Housel: The Sequel to The Psychology of Money, and What It Means for TradersHousel's 2026 follow-up turns from building wealth to using it, and argues spending well is a psychological art, not a math problem. The same wiring that makes people spend to impress (envy, status, never feeling "enough") is the wiring that makes traders overtrade, oversize and chase.
- Investing in America by Meb Faber: 250 Years, One Bull Market, and a Warning for TodayTimed to America's 250th birthday, Faber's 2026 book is a chart-and-photo history of US markets: $1 invested in 1800 would be worth roughly $200 million today. But it's not cheerleading. Faber pairs the optimism with a warning about record valuations and a case for global rebalancing, and its real power is as an antidote to panic selling.
- Jim Chanos: The Short-Seller Who Called Enron, and Is Sounding the Alarm on AIChanos spent 38 years finding the rot others missed, most famously Enron. His method is forensic: read the footnotes and believe the numbers over the narrative. Now he is one of the loudest skeptics of the AI data-center build-out, and his career is also the clearest lesson that being right and being early are different skills.