The Technology Was Real. The Returns Weren't.
In the mid-1840s Britain was in the grip of the largest railway investment boom it had ever seen. Investors included Charles Darwin, John Stuart Mill and the Brontë sisters. The railways were real, useful and transformative, and the people who financed the 1840s boom lost heavily anyway. A century and a half later the same pattern played out with the internet: the Nasdaq Composite closed at 5,048.62 on March 10, 2000, fell 78.4% over the next 31 months, and did not close above that level again until April 23, 2015. The internet, meanwhile, went on to change everything.
Key takeaways
- Almost every great technology bubble was built on a technology that worked. The investors lost anyway, because price ran ahead of how fast profits could arrive and who would keep them.
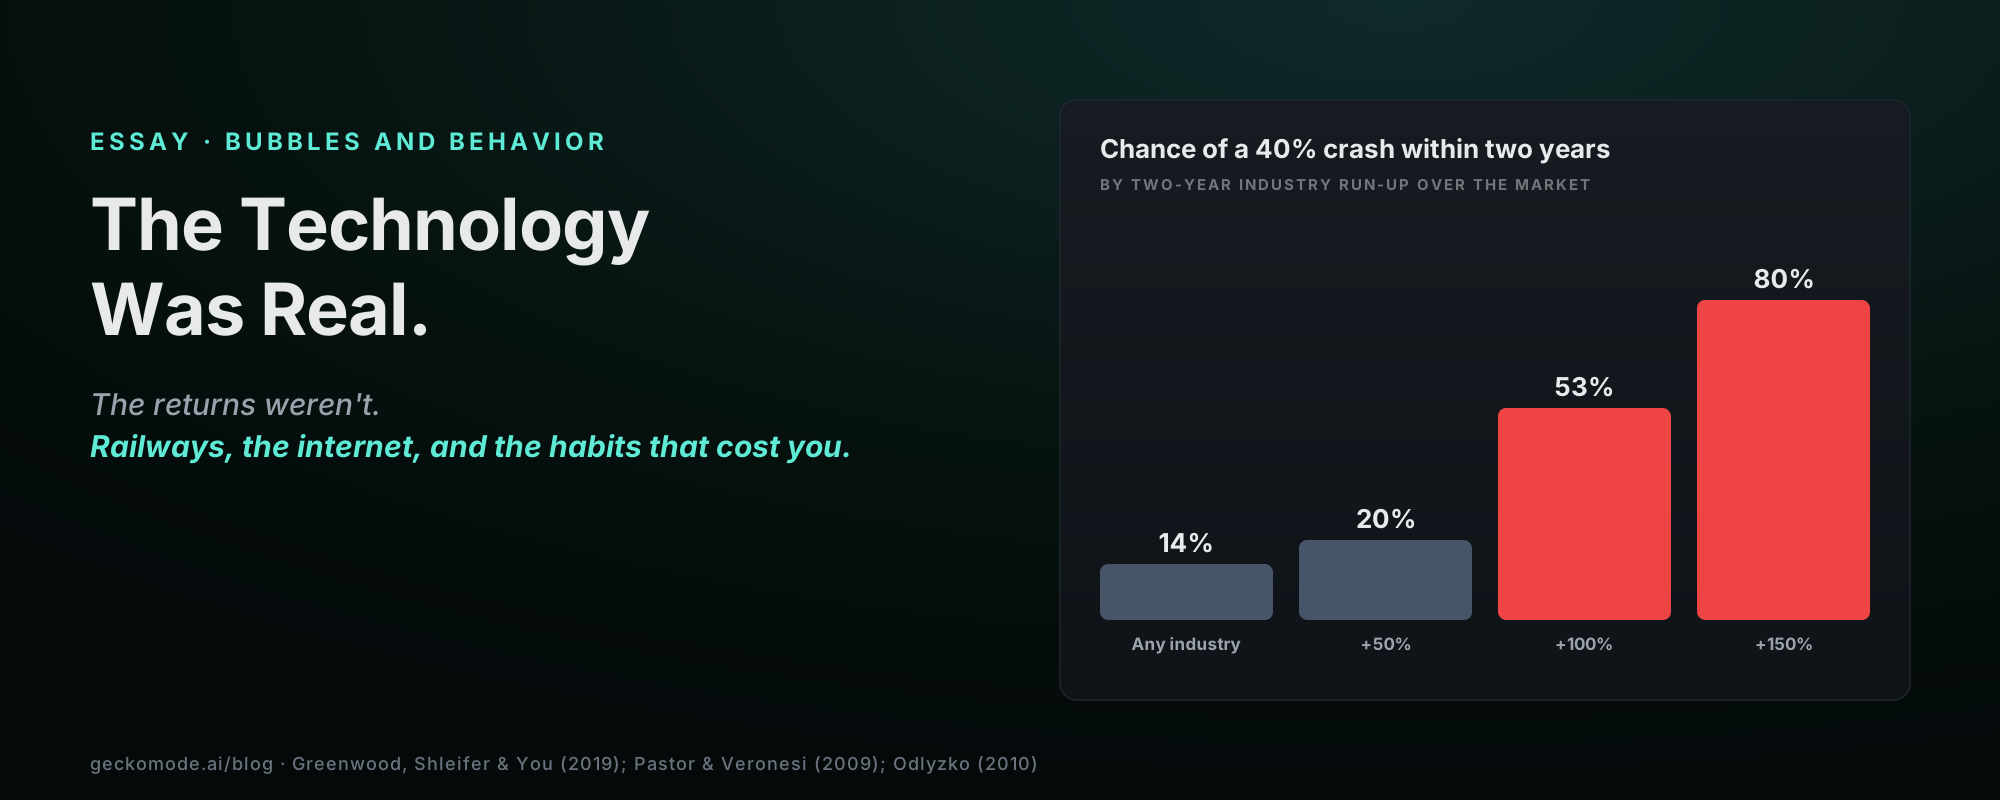
- Research finds a sharp run-up does not reliably predict low average returns, but it does sharply raise the odds of a crash. In one study, a two-year industry run-up of 100% over the market lifted the chance of a 40% drawdown from 20% to 53%.
- The traders hurt most are rarely the skeptics or the early believers. They are the ones who arrive late, size up on the excitement, and hold through the fall because the story is still true.
- You cannot reliably time a bubble. You can measure whether your own trading changes when one is under way.
Why real technologies produce bubbles
It is tempting to explain bubbles as madness. Economists Lubos Pastor and Pietro Veronesi offer a more unsettling explanation. In “Technological Revolutions and Stock Prices” (American Economic Review, 2009), they model investors who are genuinely uncertain how productive a new technology will be and learn about it over time. Prices of innovative firms run up and then fall as the technology is adopted and the risk becomes economy-wide. The resulting bubbles are, in their words, observable after the fact but unpredictable in advance, and most pronounced for technologies with high uncertainty and fast adoption. They find support for the model in two American episodes: railroads from 1830 to 1861 and the internet from 1992 to 2005.
The point for a trader is not that markets are rational or irrational. It is that a boom can be built on reasonable beliefs and still end in a crash, so being right about the technology protects you less than you think.
The 1840s: when critics are right and still ignored
Mathematician and historian Andrew Odlyzko calls the British Railway Mania of the 1840s “by many measures the greatest technology mania in history,” and its collapse one of the greatest financial crashes. What makes it instructive is that the warning signs were visible. Odlyzko argues that trustworthy figures already showed railway traffic could not support the revenues investors expected, and the mania had powerful, vocal critics. Investors ignored both for years, until the lines opened and the traffic did not arrive.
Two details matter for traders. First, the investments were heavily leveraged: buyers put down a deposit and owed further payments, or “calls”, as construction proceeded, so a fall in share prices arrived with a demand for more cash. Second, an earlier railway boom in the 1830s had collapsed and then been vindicated as its lines succeeded. That memory taught a generation that the doubters were always wrong, which is exactly the lesson that made the 1840s so costly.
The 2000s: the crowd that arrived last
The dot-com boom offers a cleaner view of who gets hurt. Robin Greenwood and Stefan Nagel studied mutual fund managers through the technology bubble in “Inexperienced Investors and Bubbles” (Journal of Financial Economics, 2009). Funds run by younger managers held more technology stock relative to their benchmarks near the peak, and young managers, unlike older ones, chased the trend: they added on the way up and cut on the way down. Large inflows into their funds magnified the effect.
The interpretation is not that young people are reckless. It is that someone whose whole career sits inside a rising market extrapolates from the only data they have. That describes most retail traders who entered during a strong run.
What the data says about timing a bubble
Can you spot a bubble and step aside? Greenwood, Shleifer and You tested Eugene Fama’s view that bubbles cannot be identified, using US industry returns from 1926 and international sectors from 1985 (“Bubbles for Fama,” Journal of Financial Economics, 2019). Their findings cut both ways:
- Fama is right that a sharp run-up does not, on average, predict unusually low returns afterward. Some industries keep rising, and peaks are hard to call.
- But run-ups do predict crashes. In the working-paper version, an industry up 100% over the market in two years had a 53% chance of a 40% drawdown within the next two years, against 20% after a 50% run-up and about 14% unconditionally. After a 150% run-up, the figure was 80%.
- The shape of the run-up matters. Features including volatility, turnover, share issuance and the shape of the price path helped forecast the crash.
| Two-year industry run-up over the market | Chance of a 40% drawdown in the next two years |
|---|---|
| Unconditional | About 14% |
| 50% | 20% |
| 100% | 53% |
| 150% | 80% |
Read that carefully. It does not say “sell when something doubles.” It says that after a big run-up, the range of outcomes widens sharply on the downside, so position size, not prediction, is the variable you control.
The four habits that turn a boom into a personal loss
Across these episodes the damage concentrates in a few behaviors, and every one of them leaves a trace in a trade history:
- Late entry on attention. Buying after the move is on every front page. Barber and Odean (2008) found individual investors are net buyers of attention-grabbing stocks. More in All That Glitters.
- Size that grows with the story. Position size rising as conviction rises, so the largest exposure is carried at the highest prices.
- Holding the thesis, not the trade. Refusing to exit a falling position because the technology is still real.
- Leverage and margin. The 1840s calls and today’s margin and options share one effect: they convert a drawdown into a forced sale.
From belief to behavior: check yourself
- Late entry: what share of your buys in the hottest theme came after it was already up sharply that quarter?
- Size drift: is your average position in the theme larger than your average position elsewhere?
- Exit discipline: did losses in the theme run past your planned stop more often than losses elsewhere?
- Concentration: what percentage of your account rides on one story, across every stock, fund and option?
A free check you can run this week
Export your trades for the past 12 months. Tag every position in the market’s most talked-about theme. Compare those trades with everything else on three numbers: average size, average loss, and how often a loss exceeded your plan. If the theme trades are bigger and their losses run further, the bubble is already in your account, whatever the market does next.
Full disclosure: Gecko is our product, and it runs this kind of comparison automatically from a broker statement. A spreadsheet does the core of it.
Frequently asked questions
Can bubbles be predicted?
Not their peaks. Research finds big run-ups raise the probability of a crash without reliably predicting low average returns, which is why sizing matters more than calling the top.
Are all technology booms bubbles?
No. Odlyzko notes Britain’s 1830s railway boom ultimately rewarded investors, and some industries in the Greenwood-Shleifer-You sample never crashed.
What should a trader do differently in a hot market?
Keep position size and stop rules the same as in any other market, and measure whether you actually do.
Sources
- Pastor, L. & Veronesi, P. (2009), Technological Revolutions and Stock Prices, American Economic Review 99(4).
- Odlyzko, A. (2010), Collective hallucinations and inefficient markets: The British Railway Mania of the 1840s.
- Greenwood, R. & Nagel, S. (2009), Inexperienced Investors and Bubbles, Journal of Financial Economics 93(2).
- Greenwood, R., Shleifer, A. & You, Y. (2019), Bubbles for Fama, Journal of Financial Economics 131(1); crash probabilities from the NBER working paper.
- Reuters via Fortune (2015), Nasdaq surpasses Internet-bubble peak to set new record.
- Barber, B. & Odean, T. (2008), “All That Glitters,” Review of Financial Studies.
Essay in Gecko’s trading psychology and market history series. Figures come from the studies and reporting listed above and are approximate. Nothing here is a market forecast or a recommendation of any security or strategy. Gecko is an educational and informational tool. Educational, not financial advice. Trading carries substantial risk of loss.
Drop in a single statement. Gecko produces a one-page Behavioral Diagnosis ranking your costliest habits in actual dollars. Free to start. No card. No broker connection.
Short notes, usually once or twice a month. Unsubscribe in one click.
No account needed. We use your email only to send Gecko blog posts, and the link at the bottom of every email opts you out in one click.
More on the blog
- A Random Walk Down Wall Street by Burton Malkiel: Still Right After 50 Years, With One Modern CatchMalkiel's 1973 classic told ordinary investors to stop trying to beat the market and simply own it, cheaply, for the long run. Fifty years on the evidence has aged well: $10,000 in the first index fund at the start of 1977 grew to about $2.1 million by 2022. He's honest that markets aren't perfectly efficient. The catch he couldn't foresee: the index he told you to buy is now roughly a third seven stocks, so diversified indexing has quietly become a big-tech bet.
- Concentrated Portfolios vs Index Funds: What the Research Really Says, and Why the Index Isn't What It Used to BeBessembinder's landmark study found that since 1926 about 4% of US stocks created all of the market's net wealth above Treasury bills, and most individual stocks trailed cash. That fact makes concentration a long-odds bet and broad indexing the evidence-based default. It also explains the Magnificent Seven, now roughly a third of the S&P 500: buying the index today means a concentrated bet on a few mega-caps. A few winners driving everything is old; how concentrated the index has become is not.
- Risk and Reward by Ben Carlson: The 2026 Book That Takes a Wrecking Ball to Its Own AdviceBen Carlson's 2026 book stress-tests his own stay-the-course philosophy against the 1930s, Japan's 1980s bubble and the dot-com bust. Its lesson in four words: risk and reward are inseparable. You earn the return by surviving the risk, and history shows the danger is rarely the crash itself but what investors do during it. Superb on philosophy and plan; the one gap is measuring whether your own behavior matches the advice.