Trading Through Geopolitical Turmoil: The Market Recovers, the Panic Seller Doesn't
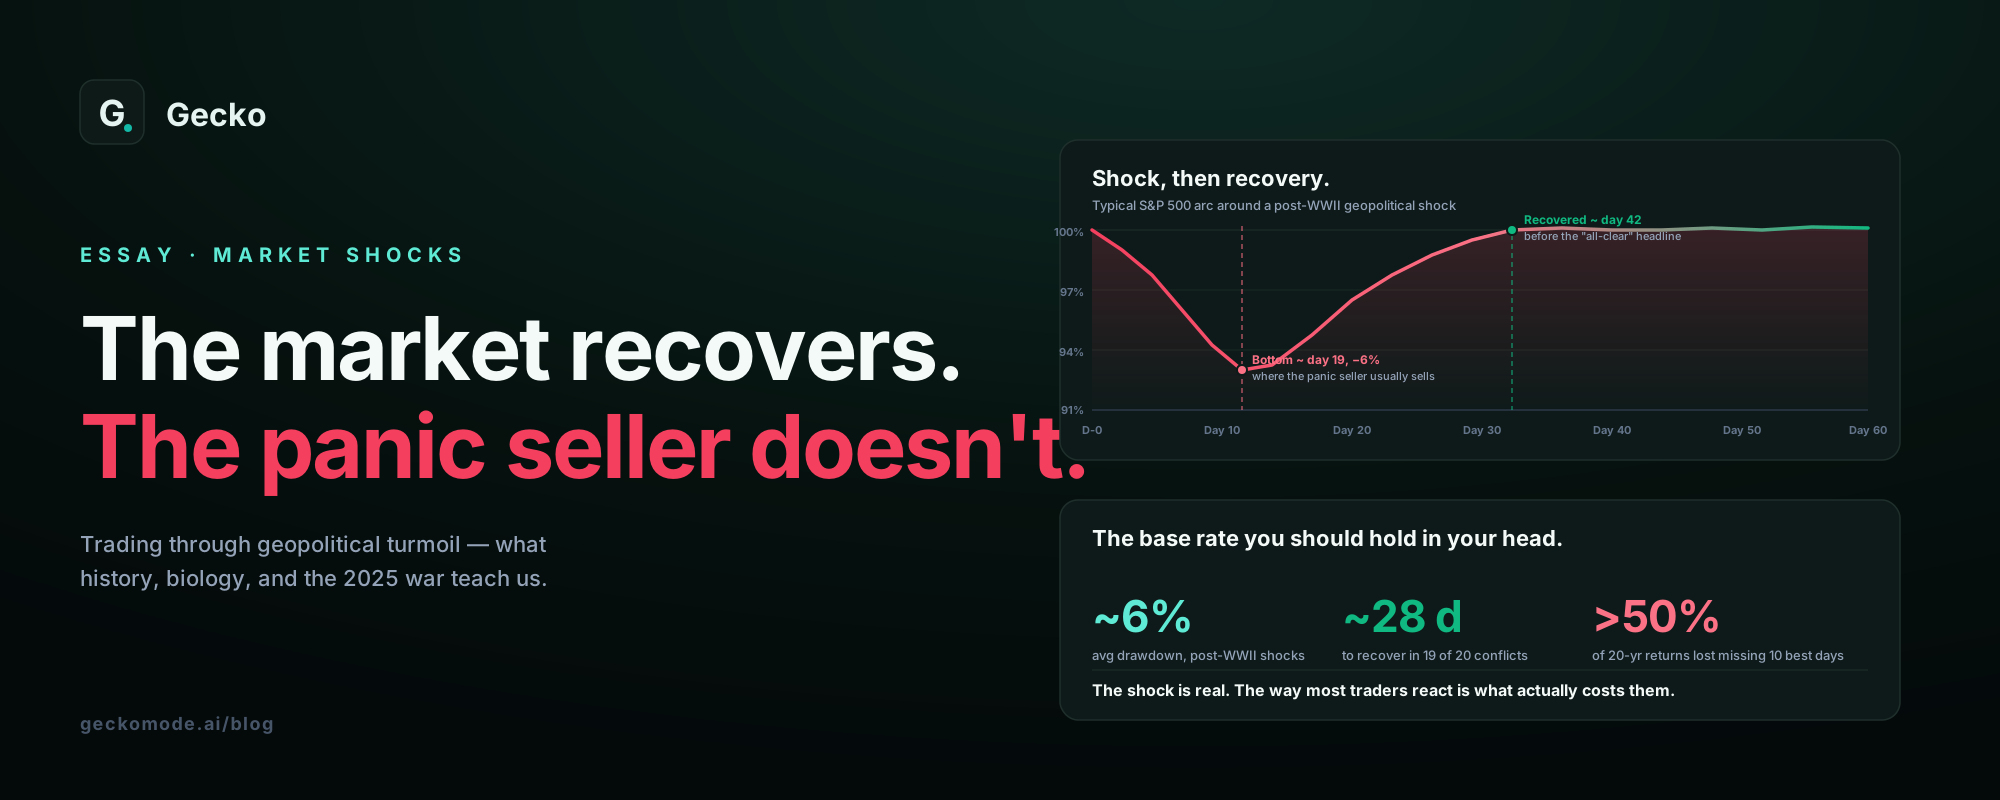
Every few years the same scene repeats. A headline breaks — an invasion, a missile strike, a capital under threat — and within minutes the questions start. Should I sell everything? Should I buy oil? Should I short the open? The instinct to do something in the face of frightening news is one of the most human responses there is. It is also, according to eight decades of market history, one of the most reliably expensive.
This is not a claim that geopolitics doesn't matter, or that markets always shrug off war. It is a narrower and better-documented point: the way most traders react to geopolitical turmoil costs them far more than the turmoil itself. The 2025 Israel-Iran war gave us the clearest recent illustration, and the historical record behind it is remarkably consistent.
Key takeaways
- Across major post-WWII geopolitical events, the S&P 500's average drawdown has been modest (roughly 5 to 7 percent) and the recovery fast (about 28 to 55 days), per LPL Research.
- Academic work on the Geopolitical Risk Index (Caldara & Iacoviello, 2022) finds a short-lived but real drop in equities, with the effect concentrated and defense stocks often gaining.
- The costliest error is behavioral: MIT research shows panic selling is predictable, clusters in downturns, and disproportionately hits experienced, confident investors — the ones who think they're being decisive.
- Because the best days cluster next to the worst, selling into a shock and waiting for the "all clear" tends to miss the rebound entirely.
- The exception that proves the rule: when war overlaps a real economic shock (oil embargo, recession), drawdowns deepen — which is a reason to size and plan, not to trade the headline.
What the history actually shows
Start with the base rate, because it is the single most useful number a trader can hold in their head when the sirens start. LPL Research, studying major geopolitical shocks going back to World War II, found the S&P 500 draws down about 7 percent on average, bottoms in roughly 19 days, and fully recovers its losses in around 42 to 55 days — less than two months. A separate cut of 20 major post-WWII military conflicts found an average drawdown near 6 percent, with the market back to pre-event levels in about 28 days in 19 of the 20 cases. The shock is real. It is also, on the historical average, shallow and brief.
The individual episodes tell the same story with more texture:
Oil spiked as Iraq invaded Kuwait and the S&P 500 fell roughly 20 percent into an October 1990 low — but selling that bottom meant missing a rally of about a third over the following eight months. The drawdown owed as much to a coincident recession and oil shock as to the war itself.
Markets closed for four sessions; the S&P dropped about 11 to 12 percent in the first week back, then recovered those losses within roughly a month.
The invasion hit an already-falling, inflation-and-rate-hike market. The initial gap lower reversed within a day, but the broader bear owed to the Fed, not the front line — the classic "war plus macro" case.
A near-perfect illustration of the pattern, examined below.
The through-line is the caveat, not just the reassurance. When a conflict is a contained military event, the market treats it as noise and recovers in weeks. When it is welded to a genuine economic shock — an oil-supply cut, an inflation spiral, a recession already underway — the drawdown is deeper and slower. The war is rarely the whole story; what else is happening in the economy usually is.
The 2025 Israel-Iran war, in real time
The most recent episode is worth walking through because it compresses the entire lesson into two weeks. On June 13, 2025, Israel struck Iranian nuclear facilities. The S&P 500 fell about 1 percent, the Dow around 1.8 percent, and Brent crude jumped roughly 7 percent to about $73 on fears that Iran would choke the Strait of Hormuz, the chokepoint for around a fifth of the world's seaborne oil. So far, textbook fear.
Then came the part that breaks the intuition. When the United States struck Iranian nuclear sites and Iran retaliated with missiles at a US base on June 23 — the single most alarming headline of the whole conflict, the exact moment a panicked trader would smash the sell button — oil fell back below $70 and equities rose. Why? Because the strait stayed open, the retaliation looked calibrated rather than escalatory, and the market concluded the worst case was off the table. The scariest moment coincided almost precisely with the turn.
In a war, the market often prices the fear before the event and the relief before the resolution. The trader reacting to the headline is trading a move that already happened.
Anyone who sold on the June 13 strike and waited for a "safe" re-entry after the June 23 escalation did the worst possible thing in the correct-feeling order: sold near the fear, bought back near the relief, and paid for both the exit and the round trip. Being right that the war was serious did not help. The market had already moved.
Why the headline is a trap, not a signal
Plenty of information moves markets. What makes geopolitical news uniquely dangerous for a trader is that it arrives loud, fast, and emotionally, hijacking exactly the machinery that already ruins accounts.
It triggers loss aversion
Kahneman and Tversky's prospect theory established that the pain of a loss is felt about twice as intensely as the pleasure of an equivalent gain. A war headline is a loss-threat siren, and it pushes the trader to act to stop the pain now, regardless of the odds — the emotional engine behind selling the bottom. The biases are the subject of our review of Thinking, Fast and Slow.
It manufactures urgency and overtrading
Rolling coverage makes it feel like every hour demands a decision. That urgency is precisely what drives overtrading — more trades than any edge can support — on days when spreads are wide, volatility is high, and the odds of an emotional error are at their peak.
It rewards the illusion of the obvious trade
"War means buy oil and defense" feels like insight. But research on the Geopolitical Risk Index shows those responses are real yet fast, often priced within hours. Buying the obvious war trade after the headline usually means paying up for a move the market already made, then oversizing it because it feels certain — a direct hit to size discipline.
Panic selling is predictable — and it's the experienced who do it
The most important research here is not about markets at all; it is about traders. In "When Do Investors Freak Out?", a team led by MIT's Andrew Lo studied more than 650,000 brokerage accounts and found that panic selling — dumping most of an account's equity in a single month, largely through trades — is both predictable and clustered around sharp downturns. The uncomfortable finding: the investors most prone to freaking out are disproportionately male, older, married, and, tellingly, those who describe their own investment experience as excellent. Confidence is not protection here. It is a risk factor. The trader most sure they can read the geopolitical situation is statistically among the most likely to hit sell at the low.
Pair that with the arithmetic of recovery and the trap closes. Because the market's best days sit right next to its worst — often within the same volatile fortnight a war creates — being out of the market for the rebound is devastating. JPMorgan's long-running analysis finds that missing just the 10 best days over a 20-year span can cut total returns by more than half. The panic seller doesn't just realize a loss. They are frequently on the sidelines for the snap-back that would have erased it.
What discipline actually looks like in a crisis
None of this is a case for recklessness or for pretending wars don't carry real risk. It is a case for deciding your response before the headline, when your prefrontal cortex is still in charge. In practice that means a written rule for what a geopolitical shock changes about your plan (usually: sizing, not direction), a pre-set maximum you're willing to lose in a session so fear can't set the number for you, and a hard bias against opening new discretionary positions in the first hours of a shock, when the emotional error rate peaks. The professionals who navigate these events are not the ones with the best geopolitical read. They're the ones whose behavior doesn't change when the screen turns red.
From belief to behavior: measure your last crisis
You don't have to wonder whether headlines trade you. The last time markets convulsed, your account recorded exactly what you did. Every geopolitical reflex leaves a fingerprint.
What did the last shock actually cost you?
Upload a broker statement and Gecko scores your overtrading, tilt, and sizing in dollars, across twelve behavioral axes — so you can see whether the headlines were trading your account. No login or broker connection needed, and your first 100 trades are analyzed free.
An educational tool, not financial advice.
Resources and further reading
- Academic — measuring the risk: Caldara, D. & Iacoviello, M. (2022), "Measuring Geopolitical Risk," American Economic Review 112(4): 1194-1225. The news-based Geopolitical Risk (GPR) Index; equities show a short-lived but significant drop, defense stocks positive.
- Academic — the behavior: Elkind, Kaminski, Lo, Siah & Wong (2022), "When Do Investors Freak Out? Machine Learning Predictions of Panic Selling," Journal of Financial Data Science. 653,455 accounts; panic selling is predictable and concentrated among experienced, confident investors.
- Foundational — loss aversion: Kahneman, D. & Tversky, A. (1979), "Prospect Theory: An Analysis of Decision under Risk," Econometrica.
- Market history: LPL Research, "Lessons from Past Conflicts for Today's Stock Market" — average post-WWII geopolitical drawdown and days-to-recover statistics.
- Broker research on the 2025 war: Charles Schwab, "Iran War: Ceasefire Offers Relief, Not Resolution"; Morgan Stanley, "Iran War Oil Shock: Stock Market Impacts" — sector and oil analysis of the Israel-Iran conflict.
- The cost of missing the rebound: J.P. Morgan Asset Management, Guide to Retirement — impact of missing the market's 10 best days over 20 years.
Frequently asked questions
What happens to the stock market during war?
Historically the reaction is sharp but short. Across major geopolitical shocks since World War II, the S&P 500 has fallen roughly 5 to 7 percent on average, bottomed in about three weeks, and recovered within one to two months — recovering in around 28 days in 19 of 20 major conflicts. The deep exceptions all coincided with an economic shock such as an oil disruption or recession.
Should I sell my stocks during a geopolitical crisis?
History argues against panic selling. Bottoms tend to arrive within weeks and the best rebound days often follow the worst days immediately, so selling into fear frequently locks in the loss and misses the recovery — JPMorgan finds missing just the 10 best days over 20 years can halve total returns. This is market history, not advice for your situation.
How did markets react to the 2025 Israel-Iran war?
When Israel struck on June 13, 2025, the S&P 500 fell about 1 percent and Brent jumped ~7 percent on Strait of Hormuz fears. But when Iran retaliated against a US base on June 23 — the most alarming headline — oil fell back below $70 and stocks rose, because the strait stayed open and the conflict looked contained. The scariest moment coincided with the turn.
Which sectors do well during geopolitical turmoil?
Research on the Geopolitical Risk Index finds defense stocks tend to earn positive excess returns around shocks, and energy can spike when an oil route like the Strait of Hormuz is threatened. But those moves are usually priced within hours, so chasing them after the headline means buying what the market has already repriced.
Essay in Gecko's trading psychology series. Historical drawdown and recovery figures are drawn from LPL Research and market history; academic findings from Caldara & Iacoviello (2022), Elkind et al. (2022), and Kahneman & Tversky (1979); and 2025 conflict details from broker research (Charles Schwab, Morgan Stanley) and contemporaneous reporting, as of July 2026. Figures are approximate and may change; verify current data at the source. Gecko is an educational and informational tool. Nothing here is financial, investment, or trading advice, and nothing here is a recommendation for or against any security, sector, or strategy. Trading carries substantial risk of loss.
Drop in a single statement. Gecko produces a one-page Behavioral Diagnosis ranking your costliest habits in actual dollars. Free to start. No card. No broker connection.
Short notes, usually once or twice a month. Unsubscribe in one click.
No account needed. We use your email only to send Gecko blog posts, and the link at the bottom of every email opts you out in one click.
More on the blog
- The AI Debt Machine: Circular Financing, Off-Balance-Sheet Data Centers, and the Ghosts of Bubbles PastThe AI build-out has quietly shifted from cash to debt: hyperscaler bonds near $194 billion in 2026, private credit's share of AI financing up from about 9% to 34%, debt parked in off-balance-sheet vehicles, and a circular loop among Nvidia, OpenAI, Oracle and CoreWeave. What telecom, Enron and the 1920s say about it, and what a trader should actually do.
- When the Consumer BreaksHousehold debt booms have a long record of ending in slowdowns that forecasters miss. What that history says about markets, and about the most overlooked balance sheet in trading: your own.
- How Banking Crises Actually StartThe run is the last chapter, not the first. What 150 years of bank failures teach traders about reading stress, and about the mistakes made when the headlines finally arrive.