Per-Instrument Bleed: Which Symbols Pay You, Which Drain You
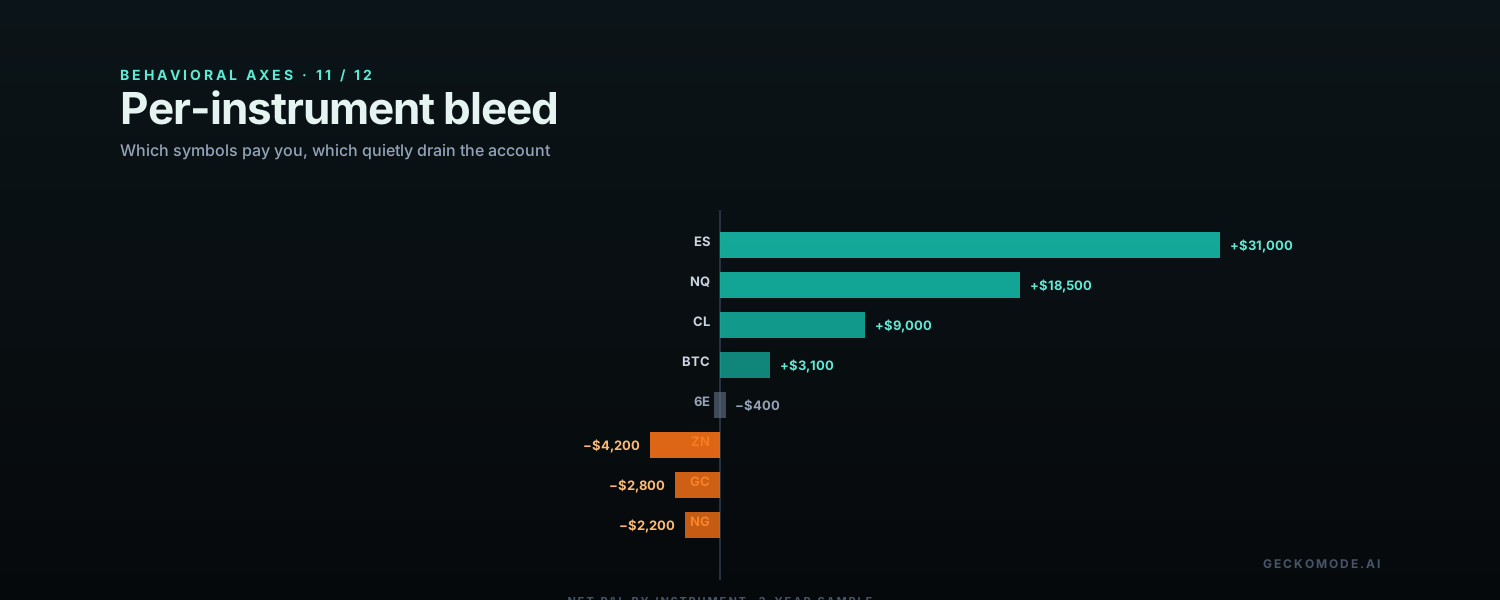
Most traders run a mixed book. A few instruments pay the rent. A few are roughly neutral. A few are quiet drains the trader has never seen on a line item. Per-instrument bleed is the axis Gecko uses to surface the drainers, in dollars, ranked. Almost every account that trades more than three or four instruments has one that is bleeding unseen, and the fix is almost always “stop trading that one.”
Why a single P&L line hides the leak
A trader who looks at their account-level P&L sees one number. That number is the sum of the trader’s actual edges and the trader’s actual leaks, netted into a single value. The leaks do not announce themselves; they just subtract from the line. A trader with a strong edge in equities can comfortably run an oil position that loses for five years before the per-instrument cut would reveal it, because the equities are doing enough work to make the overall line look acceptable.
The behavioral driver is usually familiarity rather than edge. The trader started in instrument X, knows it, sees the chart often, and keeps trading it long after the relative-performance argument has stopped working. The bleed is a sentimental attachment expressed in percentages.
The fingerprint in your trade data
| Pattern in the data | What it means |
|---|---|
| Per-instrument net P&L over 12 months shows one or more consistent negatives | An instrument is a long-term drain, not a bad month. |
| Per-instrument win rate is below the trader’s baseline | The trader does not have the same selection on this instrument as on their good ones. |
| Volume on the drainer is significant relative to total trade count | The leak is being repeatedly funded by attention that could be elsewhere. |
| The drainer has been negative for 3+ consecutive quarters | Durable underperformance; not a short-term mismatch with the regime. |
The math: the per-instrument cut is the cleanest cut
A trader nets +$18,000 for the year. The per-instrument cut: ES futures +$14,000, NQ futures +$8,500, CL futures −$3,200, ZB futures −$1,300. The drainers cost $4,500. Cutting both turns the +$18,000 year into a +$22,500 year on the same setups, the same risk discipline, and roughly 20 percent less trade count. Nothing about the strategy changed; the trader stopped funding the instruments their own data said to stop funding.
This is also why per-instrument bleed often correlates with overtrading: the urge to trade is rarely about a specific setup, so when the trader feels the pull, they reach for whatever chart is up. If the chart that is up happens to be the drainer, the urge funds the leak.
How Gecko measures it
The per-instrument-bleed axis ranks every instrument the trader has touched in the period by:
- Net P&L contribution in dollars.
- Per-trade expectancy on the instrument versus the trader’s baseline.
- Persistence of the contribution direction across quarters, flagged when three or more quarters in a row agree.
The diagnosis surfaces both the top three contributors (so the trader knows what to protect) and the bottom three (so they know what to cut). Most accounts have durable rank stability across both ends.
A worked example
A futures trader uploads three years of activity covering nine instruments. Top three by P&L: ES (+$31,000), NQ (+$18,500), CL (+$9,000). Bottom three: ZN (−$4,200), GC (−$2,800), NG (−$2,200). The drainers have been negative in 11 of the past 12 quarters. They account for 22 percent of trade count and −9,200 in P&L. The diagnosis is unambiguous: this trader is an equity-index trader with a respectable oil add-on, and a long-standing habit of funding metals and bonds for no measurable reason. Removing the three drainers would have added 9 percent to the three-year return on the same time and energy.
The fix: write the watchlist down, and shrink it
The remedy is structural and small:
- Define the written instrument universe. Only the instruments that have been positive contributors over a meaningful window stay on the chart-cycle.
- Remove drainers from the platform layout. Out of sight is most of the discipline.
- Re-evaluate the universe quarterly. New instruments earn a spot by performing for two consecutive quarters at the trader’s baseline expectancy or better.
- When the urge to take a trade hits, the urge can pick only from the written list. The market always has more setups than the trader has hours; spending those hours inside the proven set is the highest-leverage discipline.
What to read next
The cleanest piece on focusing on the instruments that actually pay is the Qullamaggie profile — narrow universe, deep practice. The journal comparison notes which tools surface a per-instrument P&L view at all (many do not).
Rank your instruments →Free to start. First 100 trades on the house. No broker connection required.
Drop in a single statement. Gecko produces a one-page Behavioral Diagnosis ranking your costliest habits in actual dollars. Free to start. No card. No broker connection.
Short notes, usually once or twice a month. Unsubscribe in one click.
No account needed. We use your email only to send Gecko blog posts, and the link at the bottom of every email opts you out in one click.
More on the blog
- The AI Debt Machine: Circular Financing, Off-Balance-Sheet Data Centers, and the Ghosts of Bubbles PastThe AI build-out has quietly shifted from cash to debt: hyperscaler bonds near $194 billion in 2026, private credit's share of AI financing up from about 9% to 34%, debt parked in off-balance-sheet vehicles, and a circular loop among Nvidia, OpenAI, Oracle and CoreWeave. What telecom, Enron and the 1920s say about it, and what a trader should actually do.
- When the Consumer BreaksHousehold debt booms have a long record of ending in slowdowns that forecasters miss. What that history says about markets, and about the most overlooked balance sheet in trading: your own.
- How Banking Crises Actually StartThe run is the last chapter, not the first. What 150 years of bank failures teach traders about reading stress, and about the mistakes made when the headlines finally arrive.