Overtrading: Where Your Edge Per Trade Dies
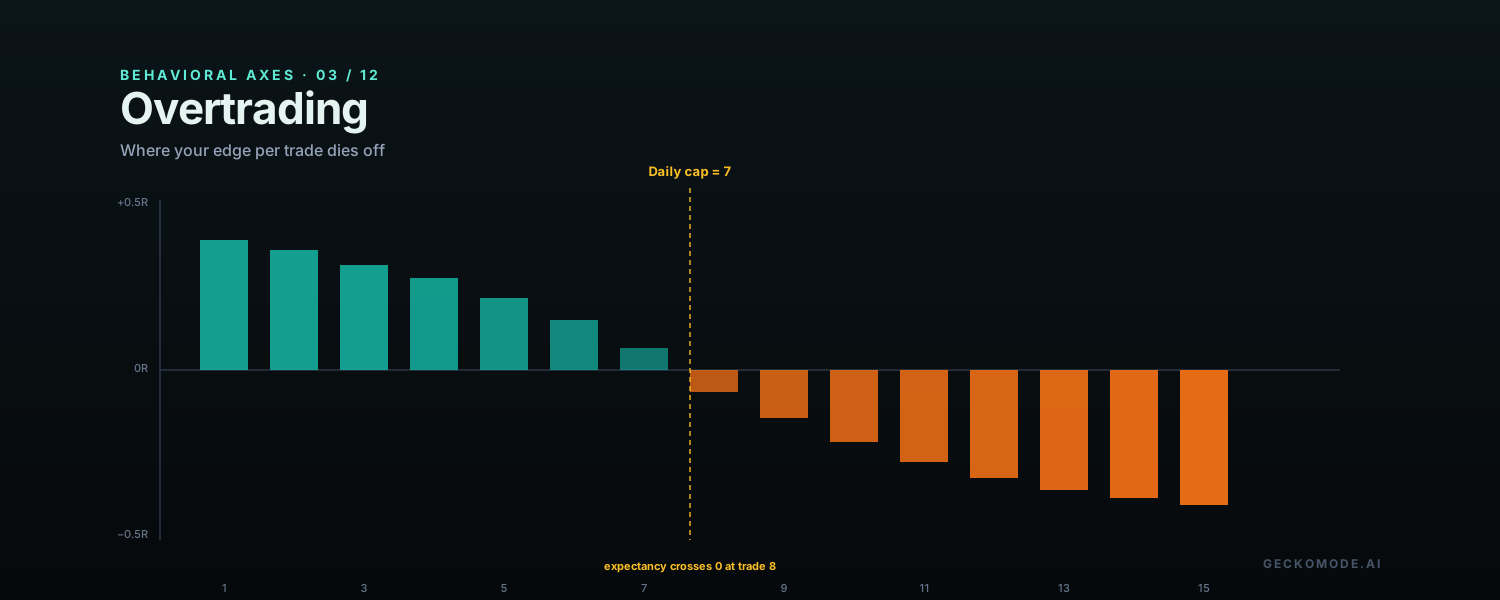
The most expensive trade a trader can take is the one that is on for a reason that is not a setup. Boredom. The need to look busy. The pull of an open platform on a slow day. The conviction that more clicks means more progress. This is overtrading: volume without edge, and one of the most reliably negative signals Gecko measures, because every overtraded entry replaces an empty slot in the calendar with a small negative-expectancy bet.
Why overtrading is not the same as being active
Activity is not the issue. Some strategies are legitimately high-frequency; some markets reward presence; some traders take twenty real setups a day. Overtrading is the gap between the trades a strategy actually generates and the trades the trader places anyway. A scalper taking forty setups a day on a strategy that produces forty setups a day is not overtrading. A swing trader taking twelve setups a day on a strategy that produces three is.
The behavioral component is structural. Open-platform time is harder to fill with disciplined inaction than the trader expects. Most accounts run an overtrading axis higher than they think they do.
The fingerprint in your trade data
| Pattern in the data | What it means |
|---|---|
| Trade count per session well above the session’s rolling median | A session is producing more trades than the trader’s own normal pace. |
| Average expectancy per trade falls as session trade count rises | Marginal trades are worse than first trades; selection is degrading with volume. |
| Time between trades shrinks toward the end of the session | Decisions are getting faster as fatigue and pressure rise. |
| Net P&L of trades 6+ in a session is negative | The trader is paying to be busy; the high-edge slots came earlier. |
The math: an edge that decays with trade count
A trader with a real edge on their first three setups of the day can still lose money if their average per-trade expectancy falls below the trading cost per trade after a certain volume. Spread, commissions, and slippage are roughly constant per trade; expected gross profit per trade is decidedly not constant once the trader is hunting for marginal opportunities. The math is what the equity curve looks like when the gross edge crosses below the cost line, and the answer is: a slow, almost-invisible bleed that never names itself in any single trade.
This is why overtrading is the axis traders are most often surprised to see at the top of their leak list. Each individual loss is small. Adding them up is the diagnosis.
How Gecko measures it
The overtrading axis compares each trader’s per-session trade count distribution against their own baseline, then walks the per-trade expectancy as a function of trade index within a session. Two diagnostic questions:
- What fraction of the trader’s sessions are materially above their typical session count?
- At what trade index inside a session does expected per-trade P&L cross below zero, after costs?
The answer to the second question is the most useful number: it tells the trader, in their own data, how many trades into a day their edge typically dies. That number becomes the trader’s personal daily cap.
A worked example
An equity day trader uploads six months of activity. Median session has 5 trades. The high-volume sessions (15 or more) account for 12 percent of all sessions but 41 percent of all trades and 73 percent of all losses. When Gecko walks per-trade expectancy across the trader’s sessions, expectancy crosses below zero at trade index 8. The trader’s data tells them directly: stop after seven, or accept that everything after that is a tax on the day’s real winners.
The fix: a written daily cap
Overtrading is the axis where the rule is the cap. The trader picks a number based on their own data (Gecko suggests one) and pre-commits to it. The cap is set in the trading journal, set as a visible number on the screen during the session, and ideally enforced by the broker if the platform allows daily order limits:
- Set the daily cap at the trade index where per-trade expectancy crosses zero. Round down, never up.
- Display the count visibly during the session. A sticky note. A widget. Anything that makes “trade 5 of 7” the same kind of fact as the bid-ask.
- When the cap is hit, the platform closes. Not the chart, not the watchlist; the entire workflow.
- Reset the cap weekly based on the most recent eight weeks of data. The number drifts as the trader improves; the rule should follow.
What to read next
The two natural pairs to overtrading are after-loss tilt (which often triggers an overtraded session) and the Linda Raschke profile (whose decades of process-first writing are the cleanest antidote to volume-as-virtue thinking). The glossary entry is the short reference.
Find your daily cap →Free to start. First 100 trades on the house. No broker connection required.
Drop in a single statement. Gecko produces a one-page Behavioral Diagnosis ranking your costliest habits in actual dollars. Free to start. No card. No broker connection.
Short notes, usually once or twice a month. Unsubscribe in one click.
No account needed. We use your email only to send Gecko blog posts, and the link at the bottom of every email opts you out in one click.
More on the blog
- The AI Debt Machine: Circular Financing, Off-Balance-Sheet Data Centers, and the Ghosts of Bubbles PastThe AI build-out has quietly shifted from cash to debt: hyperscaler bonds near $194 billion in 2026, private credit's share of AI financing up from about 9% to 34%, debt parked in off-balance-sheet vehicles, and a circular loop among Nvidia, OpenAI, Oracle and CoreWeave. What telecom, Enron and the 1920s say about it, and what a trader should actually do.
- When the Consumer BreaksHousehold debt booms have a long record of ending in slowdowns that forecasters miss. What that history says about markets, and about the most overlooked balance sheet in trading: your own.
- How Banking Crises Actually StartThe run is the last chapter, not the first. What 150 years of bank failures teach traders about reading stress, and about the mistakes made when the headlines finally arrive.