When the Consumer Breaks
Consumer crises rarely start with a single event. They build quietly, as cheap credit lets households spend more than their incomes for a few years, and they end when that borrowing stops. The 2008 crisis is the famous case, but research suggests it was not an outlier. In the words of economists Atif Mian, Amir Sufi and Emil Verner, “The Great Recession was not an extreme outlier” but “followed a pattern we would expect given the tremendous rise in global household debt that preceded it.”
Key takeaways
- Across 30 economies over half a century, a rise in household debt relative to GDP predicted slower growth and higher unemployment over the following years, and it was a better warning sign than corporate debt.
- Professional forecasters at the IMF and OECD systematically missed those slowdowns, so “nobody sees it coming” is part of the pattern, not an excuse.
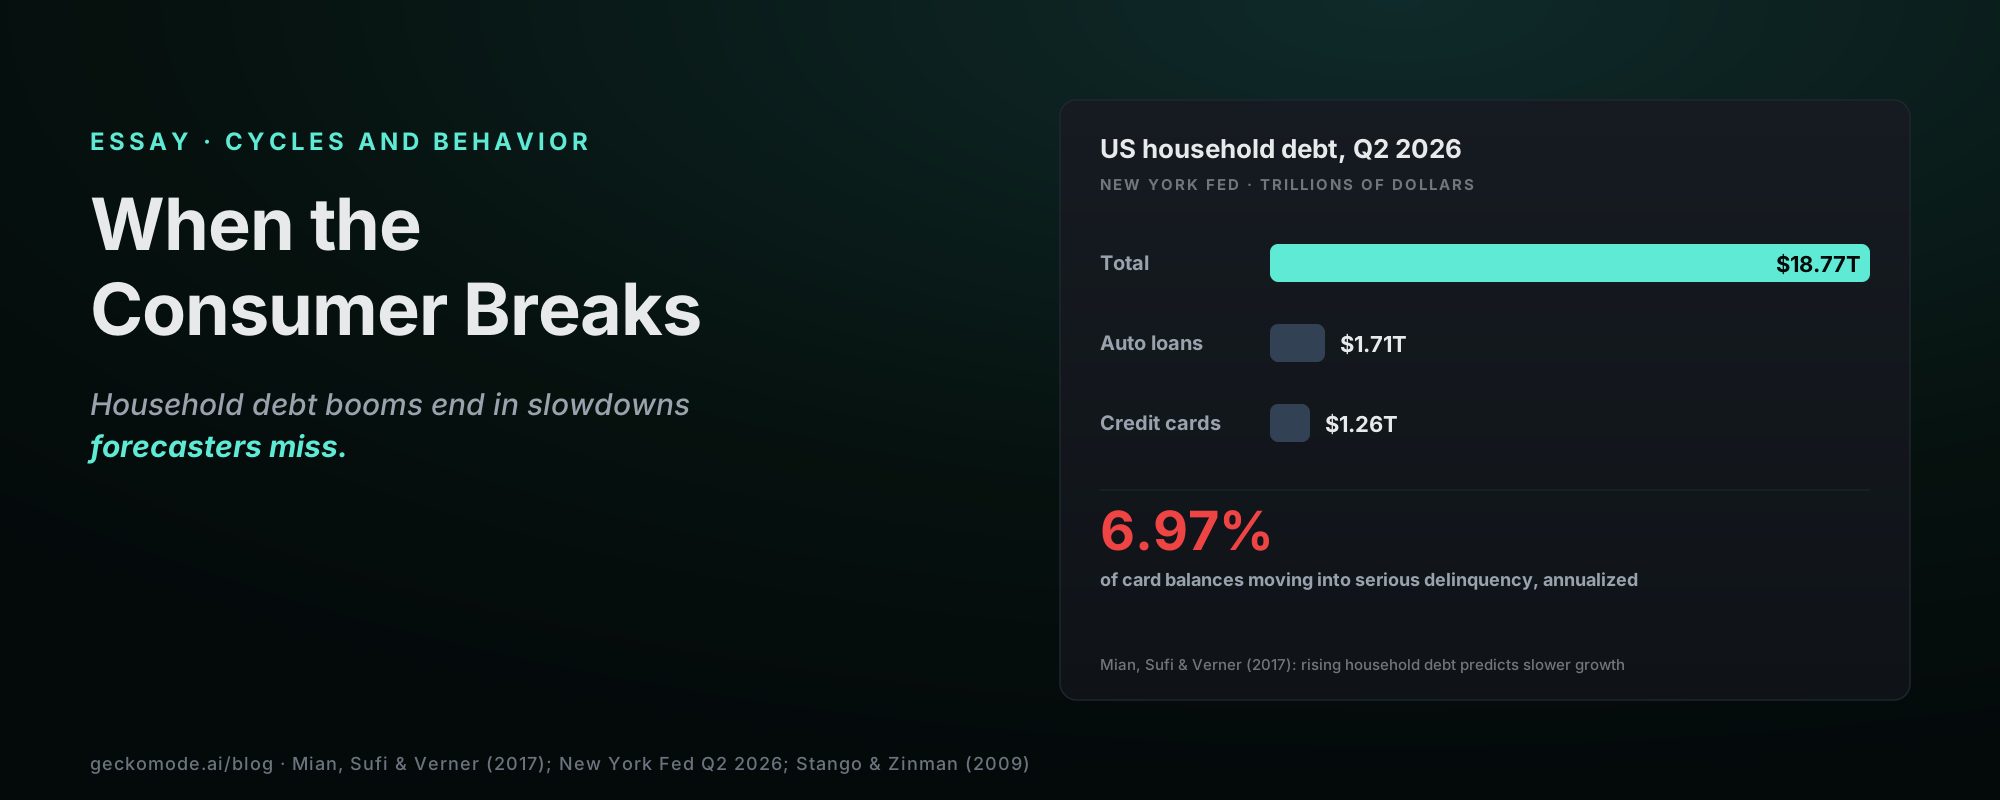
- US households owed $18.8 trillion in Q2 2026, including $1.26 trillion on credit cards. Card balances moving into serious delinquency ran at 6.97% a year, roughly flat on 2025.
- The same biases that fuel consumer debt booms, especially underestimating how fast interest compounds, show up in traders who fund their accounts with money they cannot afford to lose.
The pattern: debt up, growth down
In “Household Debt and Business Cycles Worldwide” (Quarterly Journal of Economics, 2017), Mian, Sufi and Verner studied 30 mostly advanced economies over roughly 50 years. Their findings, summarized by the NBER:
- Household debt is the stronger warning. A rising household debt-to-GDP ratio predicted slower growth and higher unemployment in the short to medium term, and it predicted downturns better than the debt of non-financial firms.
- Cheap credit starts it. Low credit spreads and more risky lending drove the debt build-up, which financed a consumption boom and rising imports.
- The slowdown surprises the experts. The expansion in household debt was followed by a sharp slowdown in GDP, consumption and investment that IMF and OECD forecasters did not anticipate.
- Global booms hurt more. When many countries’ households borrow at once, no one can export their way out.
The practical reading is not “sell when credit grows.” It is that the late, comfortable stage of a borrowing boom is when forecasts deserve the least trust.
Where US households stand now
The New York Fed’s Quarterly Report on Household Debt and Credit for Q2 2026 is a useful reality check rather than an alarm bell:
| Measure (Q2 2026) | Level | Change vs a year earlier |
|---|---|---|
| Total household debt | $18.77 trillion | +$383 billion |
| Credit card balances | $1.26 trillion | +$54 billion |
| Auto loan balances | $1.71 trillion | +$58 billion |
| Card balances flowing into serious delinquency (90+ days), annualized | 6.97% | 6.93% in Q2 2025 |
| All debt in some stage of delinquency | 4.7% | Slightly improved quarter on quarter |
The New York Fed’s own summary is balanced: delinquency rates across most products have held steady for two years, but new delinquencies for auto loans and credit cards remain elevated. That is the honest state of the evidence. It does not support a crash call, and it does not support complacency.
The bias that powers consumer debt
Why do households borrow into a boom? One reason is that compounding is hard to feel. Victor Stango and Jonathan Zinman (Journal of Finance, 2009) studied “exponential growth bias,” the tendency to treat exponential growth as if it were a straight line. People with the bias underestimate the interest rate implied by a loan’s terms and underestimate how much savings will grow. In their data, more-biased households borrowed more, saved less and favored shorter maturities.
Traders carry the same bias in both directions. They underestimate how fast a margin balance or a carried card balance compounds against them, and they underestimate how much a small, steady edge would compound if they stopped interrupting it.
What traders get wrong in consumer downturns
- Trading the headline, not the cycle. A single weak retail-sales print or delinquency headline triggers big directional bets. The research describes a multi-year process, not a one-day signal.
- Funding the account with household money. When the trading account doubles as the emergency fund, a bad month at home forces selling at the worst moment in the market.
- Borrowing to trade. Margin or a credit line used to “make it back” is consumer debt with a market attached, and compounding works against it every day it stays open.
- Assuming the forecasts will warn you. The Mian-Sufi-Verner evidence says professional forecasts are weakest at the turn.
From belief to behavior: check yourself
- Separation: is your trading capital clearly separate from three to six months of household expenses?
- Deposits after losses: have you ever topped up your account soon after a drawdown? How did the next month go?
- Cost of carry: what are you paying annually in margin interest, and what does it compound to over five years?
- Headline trades: how did your trades on major consumer-data days perform against your average?
A free check you can run this week
List every deposit into your trading account over the past two years, and mark any that came within 30 days of a significant loss. Then add up a year of margin or borrowing costs. If top-ups follow losses, or carrying costs exceed a few percent of your account, the consumer crisis to worry about first is the one in your own budget. Two rules help: deposits only on a fixed schedule, never after a loss, and no borrowed money in the trading account.
Full disclosure: Gecko is our product, and it tracks deposit timing and post-loss behavior automatically from a broker statement. A spreadsheet covers the core of it.
Frequently asked questions
Does rising household debt predict recessions?
Research across 30 countries finds rising household debt-to-GDP predicts slower growth and higher unemployment over the following years, though not the exact timing.
Are US consumers in trouble now?
The New York Fed’s Q2 2026 data shows steady delinquency across most products, with new card and auto delinquencies still elevated. It is a watch item, not a verdict.
What is exponential growth bias?
The tendency to treat compounding as linear, which leads people to underestimate borrowing costs and investment growth.
Sources
- Mian, A., Sufi, A. & Verner, E. (2017), “Household Debt and Business Cycles Worldwide,” Quarterly Journal of Economics; NBER Digest summary.
- Federal Reserve Bank of New York (August 11, 2026), Household Debt Balances Decreased Slightly; Credit Card Delinquency Transition Rates Remained Steady.
- Stango, V. & Zinman, J. (2009), Exponential Growth Bias and Household Finance, Journal of Finance 64(6).
Essay in Gecko’s trading psychology and market history series. Figures come from the studies and New York Fed data listed above and are approximate. Nothing here is a market forecast or a recommendation of any security or strategy. Gecko is an educational and informational tool. Educational, not financial advice. Trading carries substantial risk of loss.
Drop in a single statement. Gecko produces a one-page Behavioral Diagnosis ranking your costliest habits in actual dollars. Free to start. No card. No broker connection.
Short notes, usually once or twice a month. Unsubscribe in one click.
No account needed. We use your email only to send Gecko blog posts, and the link at the bottom of every email opts you out in one click.
More on the blog
- How Banking Crises Actually StartThe run is the last chapter, not the first. What 150 years of bank failures teach traders about reading stress, and about the mistakes made when the headlines finally arrive.
- The Technology Was Real. The Returns Weren't.What railways, the internet and every tech boom in between teach traders about bubbles, and the habits that turn a real revolution into a personal loss.
- A Random Walk Down Wall Street by Burton Malkiel: Still Right After 50 Years, With One Modern CatchMalkiel's 1973 classic told ordinary investors to stop trying to beat the market and simply own it, cheaply, for the long run. Fifty years on the evidence has aged well: $10,000 in the first index fund at the start of 1977 grew to about $2.1 million by 2022. He's honest that markets aren't perfectly efficient. The catch he couldn't foresee: the index he told you to buy is now roughly a third seven stocks, so diversified indexing has quietly become a big-tech bet.