Time-of-Day Skew: Your Edge by the Hour
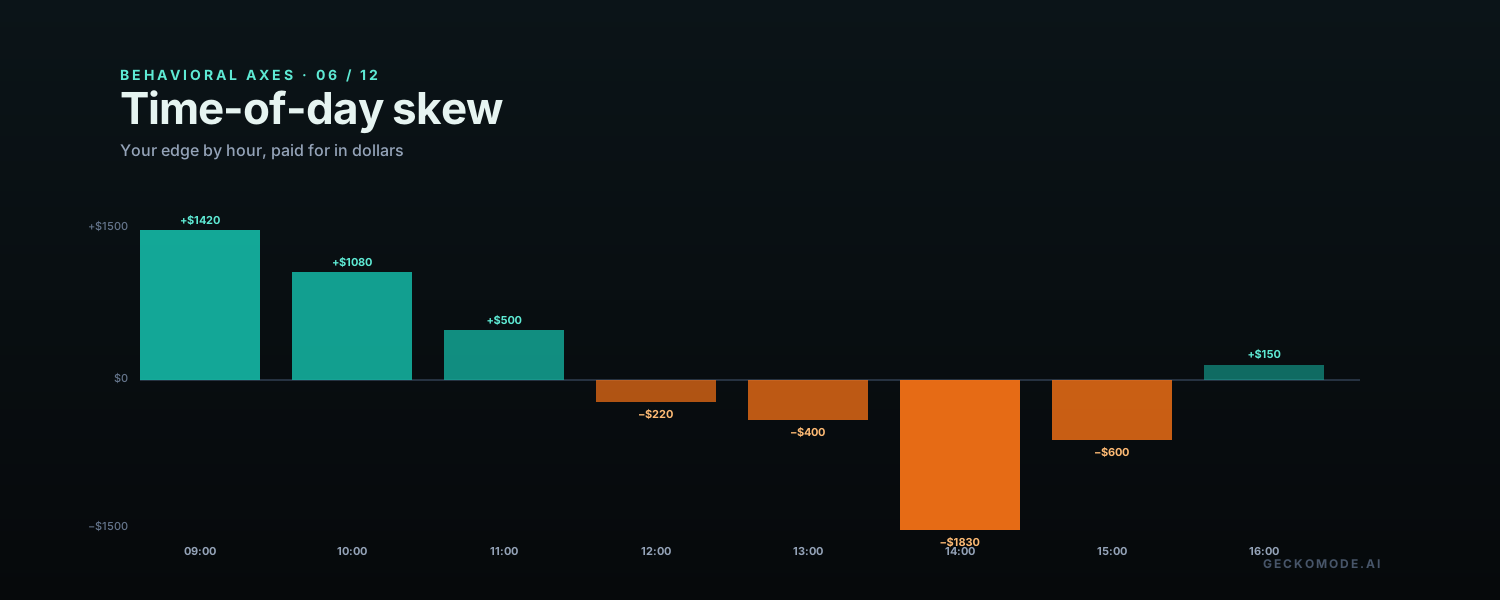
Every trader who has been at it long enough has a personal time-of-day P&L map they have never looked at. The hours their setups work in. The hours their setups don’t. The lunchtime lull where most discretionary edges go to die. The afternoon window where most blowups happen. Time-of-day skew is the axis Gecko uses to print that map directly from the trader’s own statements, in dollars, and it is one of the highest-leverage diagnoses on the platform because the fix is almost always “trade in the hours your data says you trade well in, stop in the ones it says you don’t.”
Why a personal hour map is more useful than any general advice
The trading internet is full of one-size-fits-all advice about the “best” hours to trade. The first forty minutes of the U.S. equity open. The London close. The Tokyo overlap. None of this advice is wrong; all of it is also wrong for the specific trader reading it. The hours that suit a trader’s setups, attention, and risk tolerance are not the hours that suit anyone else. The only useful map is the one drawn from the trader’s own closed trades.
The behavioral side of the axis matters as much as the edge side. The hours a trader is fresh and patient are different from the hours they are tired or distracted, and the trade data shows it cleanly. A trader who routinely produces strong P&L from 9:30 to 11:00 and gives most of it back between 14:00 and 16:00 is not battling the market in the afternoon; they are battling their own attention span.
The fingerprint in your trade data
| Pattern in the data | What it means |
|---|---|
| Net P&L by hour-of-day shows a clear positive band and a clear negative band | The trader has a real time-of-day edge in some hours and a real time-of-day leak in others. |
| Trade count per hour does not match P&L per hour | The trader is spending volume in their losing hours and missing volume in their winning hours; allocation is upside-down. |
| Win rate drops noticeably in late-session hours | Attention fatigue or end-of-session pressure is showing up in selection quality. |
| Average per-trade loss grows in low-edge hours | The trader is taking marginal trades in the wrong hours and the losses are correspondingly worse. |
The math: the cost of a single bad hour
Take a trader whose overall expectancy looks fine on paper: 100 trades, +0.3 R per trade, net +30 R for the sample. Slice by hour-of-day and the same trader shows +0.6 R per trade in their three best hours (40 trades), +0.4 R in their next four hours (40 trades), and −0.5 R per trade in the remaining three hours (20 trades). The bad three-hour band cost the account 10 R. Cutting that band from the trading schedule turns a +30 R trader into a +40 R trader on the same setups. No new strategy was learned. The trader just stopped trading the hours their own data said to avoid.
How Gecko measures it
The time-of-day-skew axis bins every closed trade by its exit hour, then computes:
- Net P&L per hour, with the band of positive hours and the band of negative hours highlighted.
- The win-rate and average-R-per-trade gap between the trader’s best and worst hour buckets.
- The ratio of trade volume to P&L per hour, flagging allocation mismatches (trading a lot in low-edge hours).
Sample-size gating matters extra for this axis because hours with five or six trades are too small to read a confident pattern out of. The diagnosis labels under- sampled hours explicitly rather than scoring noise.
A worked example
An options trader uploads four months of activity covering 180 trades. Sliced by exit hour, the 09:00 hour shows +$1, 420 net (28 trades, 64 percent win rate). The 14:00 hour shows −$1,830 net (24 trades, 33 percent win rate). The rest of the hours net out to roughly breakeven. The diagnosis: the trader has a real morning edge worth protecting and a real afternoon leak worth closing. The single highest-dollar fix is to declare 13:30 a hard stop, which would have left the account 13 percent higher across the four-month sample with the same setups.
The fix: trade your hours, not someone else’s
Time-of-day discipline is one of the easiest rules to run because the rule itself does not require any in-the-moment judgment. The trader picks their hours from the data and commits:
- Define a written trading window based on the most recent three months of data. Anything that has produced a consistent positive band gets included; anything in a consistent negative band gets excluded.
- End the session at the boundary even if a setup looks good. The setup that looks good in a known losing hour is the most expensive trade the day will offer.
- Re-grade the window every month. A trader’s edge by hour drifts as markets change and as the trader changes; the window should follow.
- Treat the window as part of the strategy, not as a lifestyle choice. The strategy includes when it is allowed to fire.
What to read next
The cleanest piece on disciplined process in fast markets is the Linda Raschke profile — start with the rule, end with the rule. The companion axis to time-of-day is overtrading; the two patterns often appear together, with overtrading concentrated in the trader’s worst hours.
Map your trading hours →Free to start. First 100 trades on the house. No broker connection required.
Drop in a single statement. Gecko produces a one-page Behavioral Diagnosis ranking your costliest habits in actual dollars. Free to start. No card. No broker connection.
Short notes, usually once or twice a month. Unsubscribe in one click.
No account needed. We use your email only to send Gecko blog posts, and the link at the bottom of every email opts you out in one click.
More on the blog
- The AI Debt Machine: Circular Financing, Off-Balance-Sheet Data Centers, and the Ghosts of Bubbles PastThe AI build-out has quietly shifted from cash to debt: hyperscaler bonds near $194 billion in 2026, private credit's share of AI financing up from about 9% to 34%, debt parked in off-balance-sheet vehicles, and a circular loop among Nvidia, OpenAI, Oracle and CoreWeave. What telecom, Enron and the 1920s say about it, and what a trader should actually do.
- When the Consumer BreaksHousehold debt booms have a long record of ending in slowdowns that forecasters miss. What that history says about markets, and about the most overlooked balance sheet in trading: your own.
- How Banking Crises Actually StartThe run is the last chapter, not the first. What 150 years of bank failures teach traders about reading stress, and about the mistakes made when the headlines finally arrive.