Trader Profile: Nancy Pelosi — The Only Trader With a Fully Public Trade Log
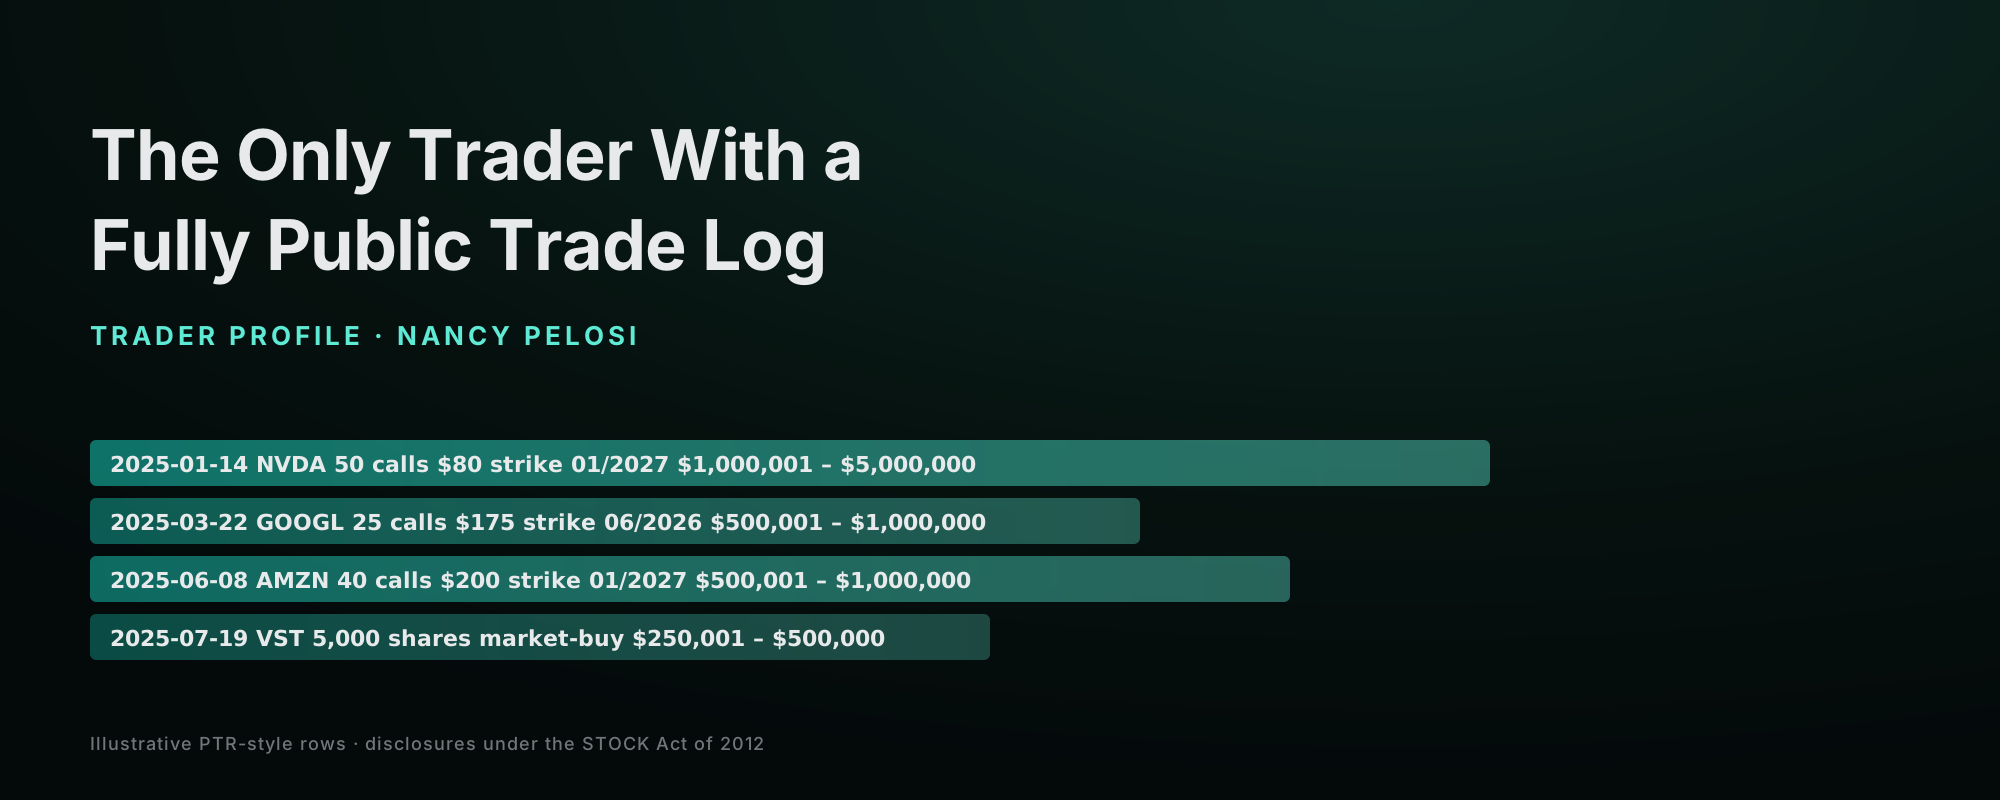
Every trader we’ve profiled on this blog — Dhaliwal, GCR, Burry, PTJ, Druckenmiller — has a track record you have to reconstruct from interviews, letters, or partial disclosures. Nancy Pelosi is the one exception. As a member of Congress, every transaction over $1,000 by her or her spouse has to be disclosed within 30 days under the Stop Trading on Congressional Knowledge (STOCK) Act of 2012. That makes her, functionally, the only “trader” on this list whose entire trade history — sizes, instruments, timing, all of it — is a public record.
That transparency is exactly what makes her worth studying. Set aside the politics for a moment. What’s actually unusual, behaviorally, about the pattern in the filings? And what does the academic literature actually say — both sides — about whether members of Congress have an investing edge?
Key takeaways
- The Pelosi household’s disclosed activity centers on a small number of mega-cap tech and AI names, often expressed through long-dated call options rather than shares — a concentrated, leveraged, low-turnover pattern.
- The academic literature on Congressional trading is not settled. Ziobrowski et al. (2004) found senators outperforming by ~10–12% annually; Eggers & Hainmueller (2014) and an NBER working paper by Belmonte & Rehmani (2020) found no persistent edge on later samples.
- The reform debate is live: the House passed the Stop Insider Trading Act in July 2026; Senator Hawley’s PELOSI Act has cleared committee. Neither is law yet.
- You can’t “trade like Pelosi” — you don’t have her disclosure lag, capital base, or (contested) information set. But the behavioral pattern underneath is worth studying regardless: size with conviction, hold through volatility, match the instrument to the belief.
The disclosure regime: why we can see her book
The Ethics in Government Act of 1978 first required Congressional financial disclosures, but on an annual basis — useful for a decade-scale portrait, useless for studying trading behavior. That changed with the STOCK Act, signed by President Obama in April 2012 after a 60 Minutes segment on Congressional trading created public pressure. The Act extended the securities laws’ insider-trading prohibitions to members of Congress and their staffs, and (more importantly for our purposes) required a Periodic Transaction Report (PTR) within 30 days of any transaction over $1,000 by the member, spouse, or dependent child.
The mechanics that matter for reading the filings:
- Amount ranges, not exact figures. PTRs report dollar amounts as bands ($1,001–$15,000; $15,001–$50,000; up to >$50,000,000). Any “Pelosi made $X million” headline is an estimate, not a directly-reported number.
- 45-day filing extension available on request; the Congressional Ethics Committees have historically been lenient about late filings. The nominal penalty for a late PTR is $200, and can be waived.
- Spouse and dependent trades count. Paul Pelosi, Nancy’s husband, is an active investor who runs the household’s brokerage account. Most of the trading attributed to “Pelosi” in the press is technically his, disclosed on her PTRs because of the spousal-reporting rule.
- The 30-day lag matters. By the time a PTR hits the public docket, the trade is at least a few weeks old — the option premium, the ticker, and the market have all moved. A retail trader trying to “follow” a filed trade is buying into a post-hoc environment, not the setup the original filer saw.
The pattern: concentrated, leveraged, and rarely trimmed
The household’s disclosed activity over the past two years centers heavily on a small number of mega-cap tech and AI names — Nvidia, Alphabet, Amazon, Broadcom, and more recently AI-adjacent energy plays (nuclear, grid infrastructure). That’s the opposite of the diversification most financial advice recommends: a small number of large, high-conviction positions rather than a broad basket. In portfolio-theory terms, the household is deliberately accepting significant idiosyncratic risk in exchange for higher expected return on any single winner.
The instrument choice is the more distinctive part. Rather than holding shares outright, a large share of the disclosed activity is in long-dated call options. For example: 50 Nvidia calls at an $80 strike bought in January 2025, later exercised into 5,000 shares, with new calls at higher strikes rolled forward into 2027. Calls in size, at strikes near or below the market price, with expirations more than a year out, are a leveraged, high-conviction directional bet. This is not a hedged or income-oriented options strategy — no covered calls, no protective puts, no iron condors. It is long-dated, in-the-money leverage on names the household expects to grind higher over multiple years.
Reporting in mid-2025 pegged the value of the Nvidia position alone at roughly $8 million, against a reported cost basis near $2.4 million. Trackers like Capitol Trades and financial press coverage have estimated cumulative gains across the portfolio in the hundreds of millions of dollars over the household’s multi-decade investing history — figures that are hard to verify precisely from filings alone, since PTRs report ranges rather than exact amounts, but the direction is not in dispute: large size, low turnover, long hold times on winners.
The academic debate: does Congress actually have an edge?
The obvious question is whether the performance is explained by access to information — hearings, briefings, committee testimony, or informal conversation that ordinary investors don’t have. This is a real academic debate, and the honest answer is that the literature is split. Both sides deserve to be cited without picking the more dramatic conclusion.
The case for a Congressional edge
Ziobrowski et al. (2004), published in the Journal of Financial and Quantitative Analysis, remains the most-cited paper in this space. The authors constructed a sample of roughly 6,000 common-stock transactions by 66 U.S. senators between 1993 and 1998, then computed calendar-time and event-time abnormal returns against matched benchmarks. Their headline finding: a long-short portfolio built from senator buys minus senator sells earned roughly 12% annualized abnormal returns — a margin the authors attributed, cautiously, to an informational advantage. The paper is careful about methodology and repeatedly notes the difficulty of ruling out alternative explanations.
A companion 2011 Business and Politics paper by the same team extended a similar (smaller, ~6% annualized) finding to the House of Representatives over 1985–2001. Together these two papers form the empirical backbone of the “Congress trades on an edge” narrative in the popular press.
The case against
Eggers & Hainmueller (2013), published in the Journal of Politics and Economics, used a later sample (2004–2008) and a different methodology. They found Congressional trades underperforming the market by roughly 2–3% annually over that period, essentially the opposite conclusion. The authors argued the earlier Ziobrowski result may have been driven by a small number of outlier trades or by benchmark-selection choices that didn’t hold up out-of-sample.
Belmonte & Rehmani (NBER Working Paper 26975, 2020) looked at senator stock-picking over a longer window (2012–2019) using transaction-level data made available under the STOCK Act. Their conclusion, from the paper’s title, is direct: “Senators are as feckless as the rest of us at stock picking.” They found no statistically significant alpha at the individual-senator level and only weak, inconsistent signals at the aggregate level — nowhere near the Ziobrowski magnitudes.
Which period, which chamber, and which methodology you use changes the answer. The Ziobrowski result may reflect a real 1990s dynamic, a small-sample coincidence, or a methodological artifact — and reasonable finance academics disagree. We’re not in a position to adjudicate that debate from a blog, and disclosures alone can’t prove intent or information access either way. Timing that looks notable in hindsight is also exactly what you’d expect to see sometimes by chance, across thousands of trades by hundreds of members over decades.
What we can say: the debate is real, unresolved, and worth knowing about before you treat any single high-profile figure’s returns as either proof of an edge or proof of nothing. The most defensible posture for a retail reader is Bayesian humility: prior odds of an information advantage exist in some cases at some times, updated by an honest reading of both sides of the academic evidence.
The legislative angle, briefly and neutrally
This debate is also live in Congress itself. In July 2026 the House passed the Stop Insider Trading Act 232–198 — a bill barring members, spouses, and dependent children from trading individual stocks — with support from nearly all Republicans and a minority of Democrats. Pelosi voted against it. Separately, Senator Josh Hawley’s PELOSI Act (Preventing Elected Leaders from Owning Securities and Investments), aimed at the same goal, has advanced out of committee.
Neither has become law as of this writing, and the Senate path for either bill is uncertain. Similar bills have been introduced in every Congress since 2012 and none has passed. We’re noting this as a live policy fact, not taking a position on it — reasonable people disagree on whether a trading ban is the right fix, and that’s a question for voters and lawmakers, not a trading blog. If the current bills do pass, Pelosi’s book (and every other member’s) would presumably move into blind trusts, which would end the research value the STOCK Act has provided over the past decade.
What retail traders should actually take from this
Don’t try to “trade like Pelosi.” You don’t have the household’s capital base, its disclosure lag, its multi-decade time horizon, or (per the unresolved academic debate above) possibly its information set. Copying the ticker is a losing exercise: by the time you see the PTR, the option premium and the underlying have moved, and you’re buying a different setup than the one the original trade captured.
But the behavioral pattern underneath the headlines is worth stealing regardless of who it belongs to:
- A small number of positions sized with conviction. The book doesn’t scale in tentatively across 40 names; it picks a handful and puts weight on each.
- Held through volatility instead of getting flinched out on every dip. Long-dated calls held past drawdowns, exercised at maturity, rolled forward.
- Instruments matched to the size of the belief. If the conviction is multi-year, use multi-year instruments; if it’s a swing trade, use swing-trade instruments. Mismatched time horizons are what burns most retail options traders.
That’s a size-and-hold-discipline pattern anyone can measure in their own trade history. Which, unlike a Congressional filing, you don’t have to wait 30 days to see. Upload a broker statement and Gecko will grade your own book on the same behavioral axes — size discipline, hold time, after-loss tilt, and nine others — and tell you which ones are actually working and which are quietly costing you money. Full disclosure, we build this; it’s free to try. But whether it’s us or a spreadsheet, the exercise is the same: separate the behavioral signal from the political noise.
Frequently asked questions
Under current law, yes — provided each transaction over $1,000 is disclosed within 30 days on a Periodic Transaction Report (PTR) under the STOCK Act, and no insider-trading violation can be established. Whether the law should allow members of Congress to trade individual stocks is a separate policy question that both the Stop Insider Trading Act (House-passed, July 2026) and Senator Hawley’s PELOSI Act are trying to change.
Most of the trading activity on the Pelosi PTRs is attributed to her husband, Paul Pelosi, an active investor who runs the household brokerage account. STOCK Act reporting requirements cover spouse and dependent-child trades, so they appear on Nancy Pelosi’s filings regardless of who placed the order.
The academic literature is split. Ziobrowski et al. (2004) found senators outperforming by ~10–12% annually on 1993–1998 data. Eggers & Hainmueller (2013) found Congressional trades underperforming by ~2–3% on 2004–2008 data. Belmonte & Rehmani (NBER 2020) found no persistent edge on 2012–2019 data. The honest reading is that the evidence supports neither a confident “yes” nor a confident “no.”
You can read the filings there — both services aggregate the public PTRs into a searchable feed. What you shouldn’t assume is that copying a filed trade captures the setup: by the time a PTR is public, the trade is at least a few weeks old, option premium and underlying have moved, and you’re buying into a different environment. Following any famous investor after-the-fact is a well-documented source of underperformance, not alpha.
Concentration + conviction + hold-time discipline, applied with instruments that match the time horizon of the thesis. It is the opposite pattern from what most overtrading retail accounts show — and it’s measurable in your own trade log, no political access required.
Trader profile in Gecko’s trading psychology series. Portfolio details, options structures, and cost-basis figures are drawn from publicly-filed STOCK Act Periodic Transaction Reports (PTRs), aggregated by Capitol Trades and reported by The Motley Fool, Yahoo Finance, TheStreet, and other outlets cited in the sources below. All PTR amounts are ranges ($1,001–$15,000, etc.) rather than exact figures; press-reported dollar totals are estimates. The academic citations to Ziobrowski et al. (2004, Journal of Financial and Quantitative Analysis), Eggers & Hainmueller (2013), and Belmonte & Rehmani (NBER Working Paper 26975) are to the published papers; our summaries are non-technical characterizations, and readers interested in the methodology should consult the originals. This profile is politically neutral, endorses no policy position on Congressional stock-trading reform, and takes no stance on any Pelosi trade, view, or party. Gecko is an educational and informational tool. Nothing here is financial, investment, or trading advice, or a recommendation for or against any security or strategy. Trading carries substantial risk of loss.
Drop in a single statement. Gecko produces a one-page Behavioral Diagnosis ranking your costliest habits in actual dollars. Free to start. No card. No broker connection.
Short notes, usually once or twice a month. Unsubscribe in one click.
No account needed. We use your email only to send Gecko blog posts, and the link at the bottom of every email opts you out in one click.
More on the blog
- The AI Debt Machine: Circular Financing, Off-Balance-Sheet Data Centers, and the Ghosts of Bubbles PastThe AI build-out has quietly shifted from cash to debt: hyperscaler bonds near $194 billion in 2026, private credit's share of AI financing up from about 9% to 34%, debt parked in off-balance-sheet vehicles, and a circular loop among Nvidia, OpenAI, Oracle and CoreWeave. What telecom, Enron and the 1920s say about it, and what a trader should actually do.
- When the Consumer BreaksHousehold debt booms have a long record of ending in slowdowns that forecasters miss. What that history says about markets, and about the most overlooked balance sheet in trading: your own.
- How Banking Crises Actually StartThe run is the last chapter, not the first. What 150 years of bank failures teach traders about reading stress, and about the mistakes made when the headlines finally arrive.