Recency Bias: Why You Expect the Market to Keep Doing What It Just Did
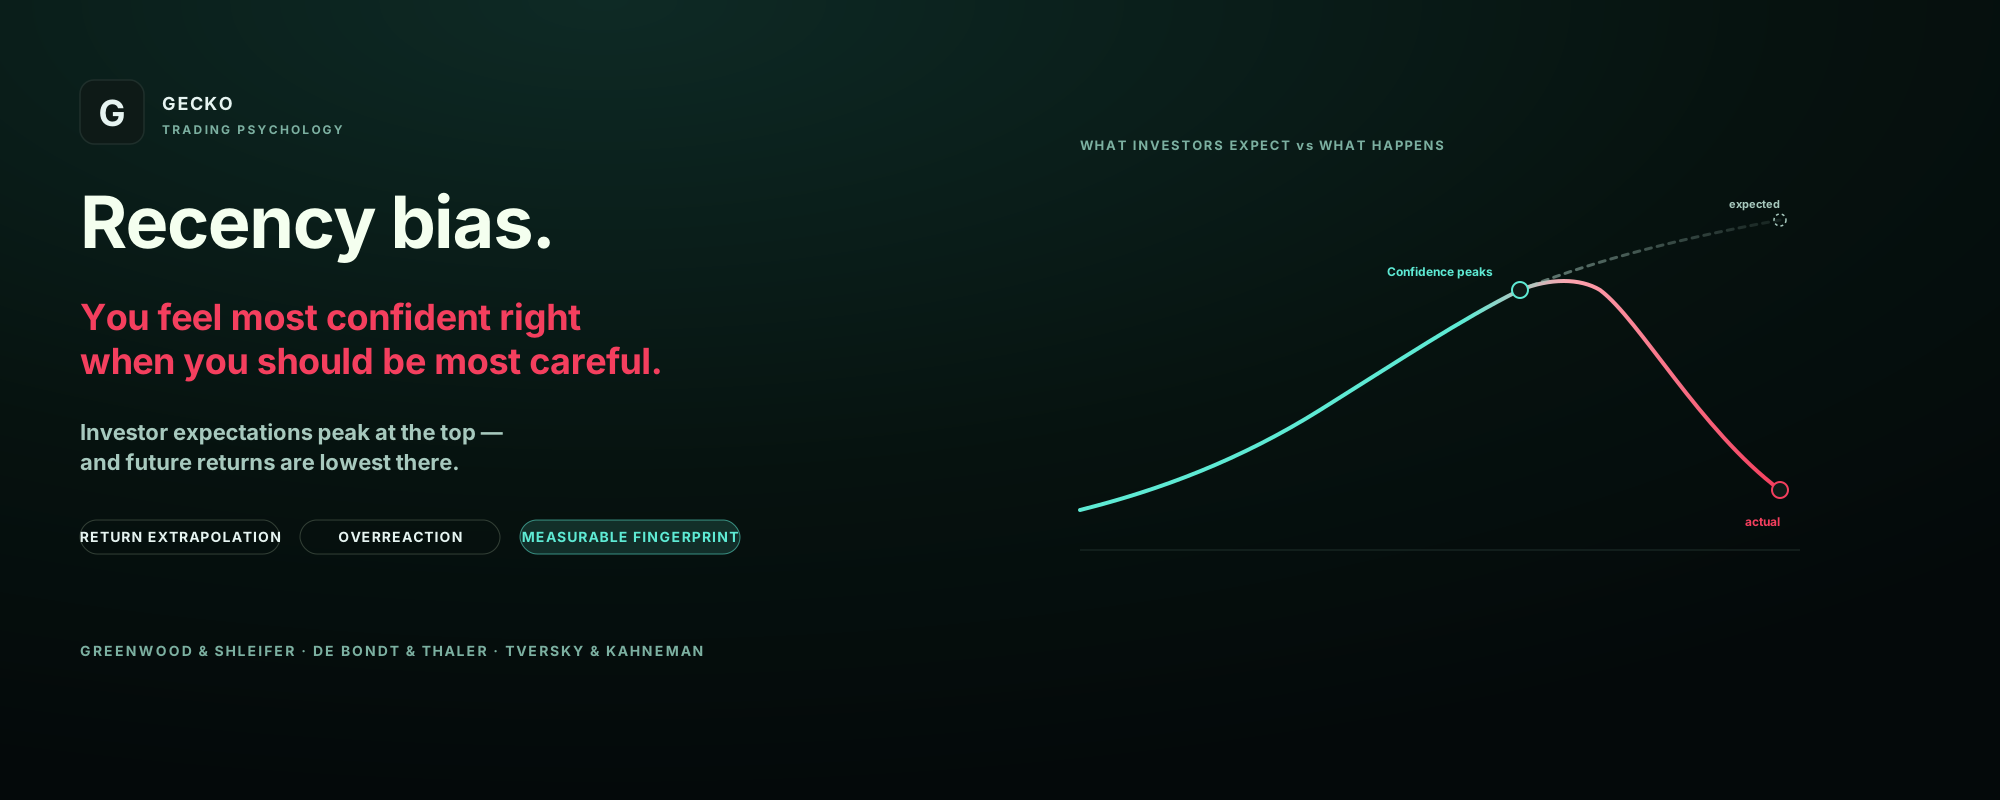
Ask an investor at the top of a raging bull market what returns they expect, and they’ll tell you: high ones. Ask them at the bottom of a crash, and they’ll tell you the opposite. This feels like common sense — you’re reading the environment, extrapolating the trend, respecting the tape. It is also, according to a remarkably consistent body of research, almost exactly backwards. The moment your expectations are highest is, on average, the moment future returns are about to be lowest. You are not reading the market. You are being fooled by the most recent thing it did.
This is recency bias, and of all the behavioral errors that drain trading accounts, it may be the most invisible, because it doesn’t feel like an error at all. It feels like prudence.
Key takeaways
- Recency bias is the habit of forecasting “more of the same” — assuming the recent past will simply continue. It’s the quiet engine behind buying tops and selling bottoms.
- Greenwood & Shleifer (2014) found investor return expectations are highest exactly when future returns turn out to be lowest — because people extrapolate recent performance.
- De Bondt & Thaler (1985) showed the market overreacts: prior “loser” stocks went on to beat prior “winners” by ~25% over the following three years.
- You feel most confident right when you should be most careful. The bias is invisible in the moment — but it leaves a clear fingerprint in when you size up and when you quit.
The evidence: expectations peak at the worst possible time
The cleanest demonstration comes from Robin Greenwood and Andrei Shleifer’s 2014 study, “Expectations of Returns and Expected Returns.” They did something deceptively simple: they gathered six separate, independent surveys of what investors said they expected the stock market to do, spanning 1963 to 2011, and compared those stated expectations to what the market actually delivered afterward.
The results are among the most quietly devastating in behavioral finance. All six measures moved together, and all six were extrapolative — strongly positively correlated with recent past returns and with the current level of the market. When stocks had been rising and prices were high, investors confidently expected more of the same. But those expectations were negatively correlated with model-based expected future returns. In other words, the times investors were most bullish were precisely the times when, on the fundamentals, future returns were likely to be poor. And this wasn’t idle survey chatter: the same optimism tracked real cash flooding into mutual funds. People didn’t just believe the recent past would continue. They bet on it, with money, at the worst moment.
The market’s most dangerous forecast is the one that feels safest: that tomorrow will look like the recent past. Investors are most optimistic at the top and most despairing at the bottom — reliably, measurably, and expensively.
The overreaction underneath it
If extrapolation pushes prices too far, something should eventually pull them back — and it does. The foundational evidence here is older, from Werner De Bondt and Richard Thaler’s landmark 1985 paper, “Does the Stock Market Overreact?” They sorted stocks into prior “winners” and prior “losers” based on multi-year performance, then tracked what happened next. The reversal was striking: the beaten-down loser portfolios went on to outperform the market by roughly 20% over the following three years, while the celebrated winners underperformed — a spread of around 25% between the two groups.
Their explanation was explicitly psychological, and it named the mechanism years before “recency bias” was a common phrase. Drawing on experimental work showing that people over-weight dramatic, recent information in violation of Bayes’ rule, they argued that investors overreact — extrapolating recent performance so aggressively that they push winners too high and losers too low, setting up the reversal. The market, in aggregate, is a recency-biased crowd, and its overshoots are the recency bias of millions of individuals stacked on top of each other.
Later work formalized this into asset-pricing models — Barberis, Greenwood, Jin and Shleifer’s “extrapolative” framework shows how a population of return-chasers can inflate bubbles and then crash them, purely from extrapolating the recent past. The takeaway for a trader is not that markets are always mean-reverting (they aren’t, cleanly), but that the instinct to expect continuation is a documented, systematic error — and one that peaks in intensity at exactly the turning points.
Why it’s invisible: representativeness
The cognitive root of all this is a mental shortcut psychologists call representativeness: we judge how likely something is by how much it resembles a recent or vivid pattern, rather than by base rates. A market that has gone up for months “looks like” a market that goes up, so we assume it will keep going up. A stock that has crashed “looks like” a bad stock, so we assume it will keep falling. The shortcut is fast, intuitive, and usually good enough in daily life — which is exactly why it’s so hard to switch off in markets, where it is precisely wrong at the extremes.
This is what makes recency bias more insidious than a bias you can feel, like fear or greed. It doesn’t announce itself. It arrives disguised as analysis — as “the trend is your friend,” as “momentum,” as a confident read of the environment. You don’t experience it as an emotion overriding your judgment. You experience it as your judgment.
The one distinction that matters: bias vs. strategy
An honest essay has to draw a line here, because “trends continue” is not always wrong. Momentum is a real, well-documented phenomenon over intermediate horizons, and disciplined momentum and trend-following strategies deliberately and profitably ride continuation — with rules, stops, and defined exits. So what separates a legitimate momentum trade from recency bias?
The difference is entirely in the structure. A momentum trader follows a pre-defined rule with a pre-defined exit, sized the same whether or not the last trade won. A recency-biased trader buys more because it went up, sizes up because they feel sure after a hot streak, and abandons the plan at the bottom because the recent pain feels permanent. Same direction, opposite discipline. Momentum is a decision made in advance and executed mechanically; recency bias is an emotion that changes your behavior in response to the recent tape. One is an edge. The other is the reason the average investor underperforms the very funds they own — the behavior gap, in one word.
What to do about it
You cannot out-feel recency bias, because in the moment it doesn’t feel like a bias — it feels like being right. The only defenses are structural. Anchor to base rates, not the recent tape: remind yourself that historically, high recent returns predict lower future ones, so a great run is a reason for more caution, not less. Fix your entry criteria and your position size in advance, so that “the last three trades won” cannot quietly inflate the next bet. And treat your own confidence as data rather than truth — when you feel most certain that the trend must continue, that feeling is itself the warning sign the research describes.
Most practically: measure it. Recency bias is one of the few biases with an unambiguous behavioral signature, and it’s sitting in your trade history.
From belief to behavior: catch yourself extrapolating
| How recency bias acts | The fingerprint in your trade history |
|---|---|
| Sizing up after wins | Position size rising during a winning streak, then a large loss when the streak ends — the classic size-discipline break driven by recent results. |
| Chasing the hot name | Entries clustered into recently high-flying tickers near extended highs — buying because it went up, not because your setup triggered. |
| Abandoning the plan at the bottom | Selling or shrinking risk right after a drawdown, then missing the recovery — recency bias in its fearful form. |
| Activity tracking the tape | Trade frequency spiking with recent volatility rather than with the quality of setups; see overtrading. |
Resources and further reading
- Extrapolative expectations: Greenwood, R. & Shleifer, A. (2014), “Expectations of Returns and Expected Returns,” Review of Financial Studies 27(3): 714–746.
- Overreaction: De Bondt, W. & Thaler, R. (1985), “Does the Stock Market Overreact?”, Journal of Finance 40(3): 793–808.
- The model: Barberis, N., Greenwood, R., Jin, L. & Shleifer, A. (2015), “X-CAPM: An Extrapolative Capital Asset Pricing Model,” Journal of Financial Economics.
- The cognitive root: Tversky, A. & Kahneman, D. (1971), “Belief in the Law of Small Numbers,” on over-inferring from small, recent samples.
- The consequence: DALBAR’s Quantitative Analysis of Investor Behavior — the behavior gap that return-chasing produces in real accounts.
Frequently asked questions
The tendency to weight the recent past too heavily when forecasting — to assume what’s just been happening will continue. In markets it appears as return extrapolation: expecting strong returns after a run, more losses after a crash. It feels like reading the trend but systematically points the wrong way at the moments that matter most.
Yes. Greenwood & Shleifer (2014) analyzed six independent surveys from 1963–2011 and found expectations strongly positively correlated with past returns and market level, and negatively correlated with actual future returns — investors are most optimistic when future returns are likely lowest, and these beliefs track real fund inflows.
Momentum is a documented tendency for trends to persist over months, exploited by disciplined rules and stops. Recency bias is the cognitive error of naively extrapolating the recent past — buying more just because price rose, sizing up after wins, quitting at the bottom. Momentum is a strategy decided in advance; recency bias is an emotion that changes your behavior in response to the tape.
Through structure, not willpower: written entry criteria that don’t shift with the mood of the tape, position sizing that doesn’t grow after winning streaks, and a base-rate anchor (high recent returns historically predict lower future ones). The most practical defense is measuring whether your own size and activity rise after wins — that’s the bias leaving a fingerprint.
Essay in Gecko’s trading psychology series. Findings are drawn from Greenwood & Shleifer (2014), De Bondt & Thaler (1985), Barberis et al. (2015), and Tversky & Kahneman (1971), and are specific to the samples and periods studied. Markets do not reliably mean-revert on any fixed schedule; nothing here is a market forecast. Gecko is an educational and informational tool. Nothing here is financial, investment, or trading advice, or a recommendation for or against any security or strategy. Trading carries substantial risk of loss.
Drop in a single statement. Gecko produces a one-page Behavioral Diagnosis ranking your costliest habits in actual dollars. Free to start. No card. No broker connection.
Short notes, usually once or twice a month. Unsubscribe in one click.
No account needed. We use your email only to send Gecko blog posts, and the link at the bottom of every email opts you out in one click.
More on the blog
- Midterm Elections Won't Move the Market the Way You Think They WillThe 2026 midterms land on November 3. Political uncertainty carries a real, measurable premium — Pastor & Veronesi's 'political risk premium' shows up in options data across 20 elections in 20 countries. S&P 500 midterm-year returns average ~4.6% since 1950 (below the long-run ~10%), with the deepest intra-year drawdowns of the four-year cycle. But the twelve months AFTER a midterm have never been negative since 1950 — ~15% avg. The real risk for most traders isn't the drawdown; it's headline-driven behavior at the account level. Party-neutral. Historical patterns, not forecasts.
- Trader Profile: Nancy Pelosi — The Only Trader With a Fully Public Trade LogEvery trader we've profiled — Dhaliwal, GCR, Burry, PTJ, Druckenmiller — has a track record you reconstruct from interviews or partial disclosures. Nancy Pelosi is the one exception. Under the STOCK Act, every household transaction over $1,000 is disclosed within 30 days. What's actually unusual, behaviorally, about the pattern in the filings — concentrated mega-cap tech, long-dated calls in size, extreme hold time — and what does the academic literature (Ziobrowski 2004, Eggers-Hainmueller 2013, NBER Belmonte-Rehmani 2020) actually say about whether Congress has an edge? Party-neutral. The debate is unresolved.
- The Portfolio-Tracker Gap: Why Balances Won't Tell You What Your Book Is DoingYour tracker shows what you own and how you're allocated. It won't tell you which position is 12% of the book without a written thesis, which name is down 30% with a stale story, or which two of your top five move in lockstep. Aggregators (Personal Capital, Kubera) and trade journals leave that middle empty. Gecko's new Portfolio Analyzer is our attempt at it — allocation + concentration + snapshot risk metrics + Sonnet review + behavioral flags on positions without a case.