Max Loss vs Typical Gain: One Bad Day Shouldn't Undo a Quarter
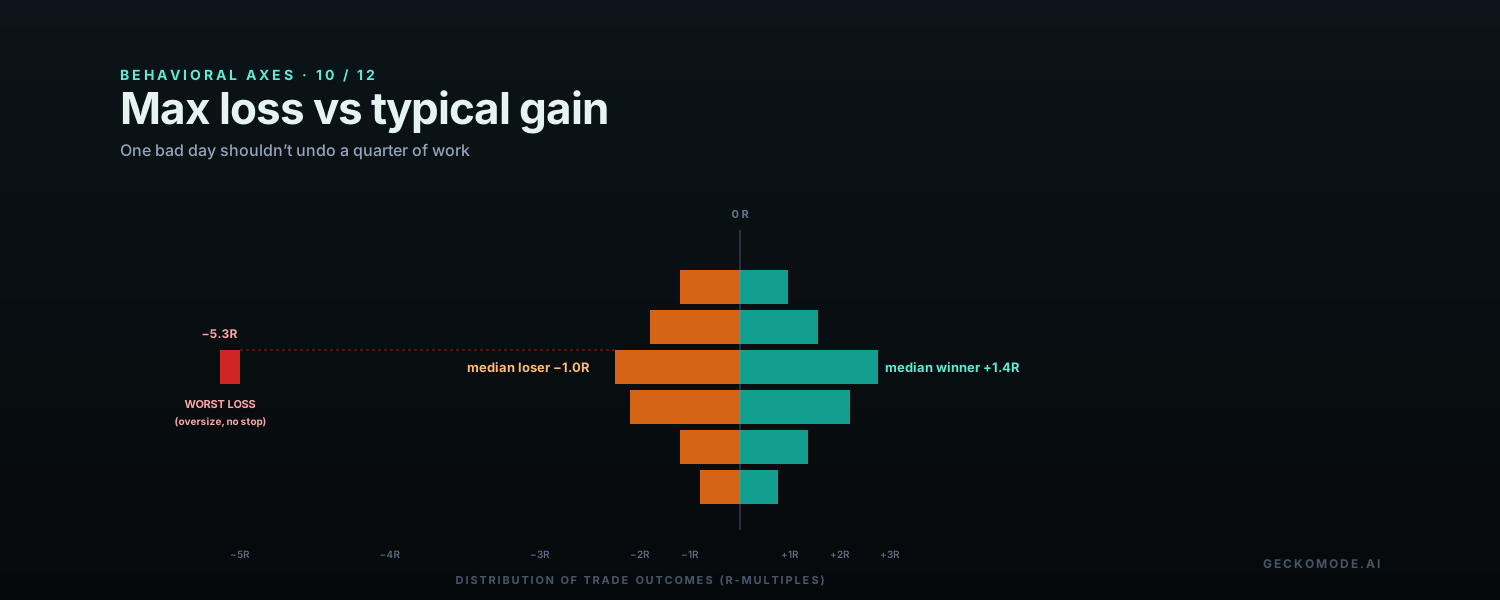
Equity curves do not move smoothly. They drift up on small wins, drift down on small losses, and then take a single large step in either direction that decides the month. The ratio of the worst-loss size to the typical-gain size is the axis Gecko uses to measure whether the rare large loss is bigger than it should be — bigger, specifically, than the trader’s typical winner. When that ratio gets to two-to-one or worse, the trader is one bad day from giving back a quarter of work.
Why the worst loss is the right benchmark, not the average loss
Average loss is comforting and misleading. The losses that matter are not the median ones; they are the tail. A trader with a clean median loss of 0.9 R and a planned stop at 1.0 R can still have a worst loss of 5 R on the trade where the stop was widened, or the trade where size was three times normal, or the trade where a gap blew through the planned exit. None of these are accidents; they are the predictable consequence of a missing discipline. The worst-loss-versus-typical-gain ratio puts a number on that consequence.
The math is what survives bad days. A trader whose typical gain is 1.5 R and whose worst loss is 4 R has to net three good trades to recover one bad one. A trader whose typical gain is 1.5 R and whose worst loss is 1.2 R has to net less than one good trade to recover. Same strategy, different equity curve dynamics, different emotional weather to trade through.
The fingerprint in your trade data
| Pattern in the data | What it means |
|---|---|
| Worst loss size > 2× typical gain size | One bad day undoes more good days than the trader expects; the equity curve will lurch. |
| Tail losses cluster on specific behaviors (oversize, no stop, weekend hold) | The cause of the tail is structural, not bad luck. It can be fixed by rule. |
| Actual stopped-out losses exceed planned stop by >25 percent | Stop discipline is being eroded somewhere — widened stops, slow exits, or gap losses. |
| Months where tail losses dominate net P&L | A small number of trades define the period; the rest is noise around them. |
The math: tail losses compound through emotion, too
The dollar cost of a 4 R loss versus a 1 R loss is just 300 percent more on that trade. The psychological cost is higher. Tail losses concentrate the trader’s drawdown into a single moment, which is emotionally corrosive even when the math works out. The trader is more likely to take a revenge re-entry, tilt the next day, or step away from the platform entirely after a tail loss than after the equivalent total damage spread across many normal losses. The axis is a leading indicator of behavioral collapse.
How Gecko measures it
The max-loss-vs-gain axis computes:
- The ratio of the trader’s worst loss (or worst-3-percent average) to their median winner.
- The breakdown of tail losses by attributable cause: oversize, late exit, gap, no stop, instrument mismatch.
- The recovery-time estimate: at the trader’s typical winner size, how many good trades are required to net the worst loss back?
A worked example
A trader uploads 300 closed trades. Median winner is +1.4 R. Median loser is −1.0 R. So far, healthy. Worst loss is −5.3 R on a single trade that was sized 3 times normal in the wake of a losing streak. Recovery: 3.8 typical winners to net it back. The axis surfaces that single trade as the defining event of the year, and the attribution layer points at the sizing rule (or its absence) as the cause. The lesson is not about a better stop. It is about refusing the trade structure that produced the tail.
The fix: cap the tail by rule, not by hope
The biggest gains on this axis come from rules that make the worst case impossible, not unlikely:
- Bracket every trade at entry. The stop is in the broker, not in the trader’s head.
- Cap maximum position size at a written multiple of baseline. No revenge sizing, no convicted-trade sizing that exceeds the cap.
- Use a daily-loss cutoff that closes the platform when hit. The third bad trade of a bad day is the most dangerous one.
- Treat any tail loss as a process review, not a market review. The trader audits what they did, not what the market did, and writes a rule that would have prevented it.
What to read next
The cleanest piece on capping tails is the Paul Tudor Jones profile; the cleanest piece on the asymmetry math is the Druckenmiller profile. The glossary entry is the one-paragraph reference.
Find your tail loss →Free to start. First 100 trades on the house. No broker connection required.
Drop in a single statement. Gecko produces a one-page Behavioral Diagnosis ranking your costliest habits in actual dollars. Free to start. No card. No broker connection.
Short notes, usually once or twice a month. Unsubscribe in one click.
No account needed. We use your email only to send Gecko blog posts, and the link at the bottom of every email opts you out in one click.
More on the blog
- The AI Debt Machine: Circular Financing, Off-Balance-Sheet Data Centers, and the Ghosts of Bubbles PastThe AI build-out has quietly shifted from cash to debt: hyperscaler bonds near $194 billion in 2026, private credit's share of AI financing up from about 9% to 34%, debt parked in off-balance-sheet vehicles, and a circular loop among Nvidia, OpenAI, Oracle and CoreWeave. What telecom, Enron and the 1920s say about it, and what a trader should actually do.
- When the Consumer BreaksHousehold debt booms have a long record of ending in slowdowns that forecasters miss. What that history says about markets, and about the most overlooked balance sheet in trading: your own.
- How Banking Crises Actually StartThe run is the last chapter, not the first. What 150 years of bank failures teach traders about reading stress, and about the mistakes made when the headlines finally arrive.