Day-of-Week Pattern: The Weekly Rhythm of Profit and Leak
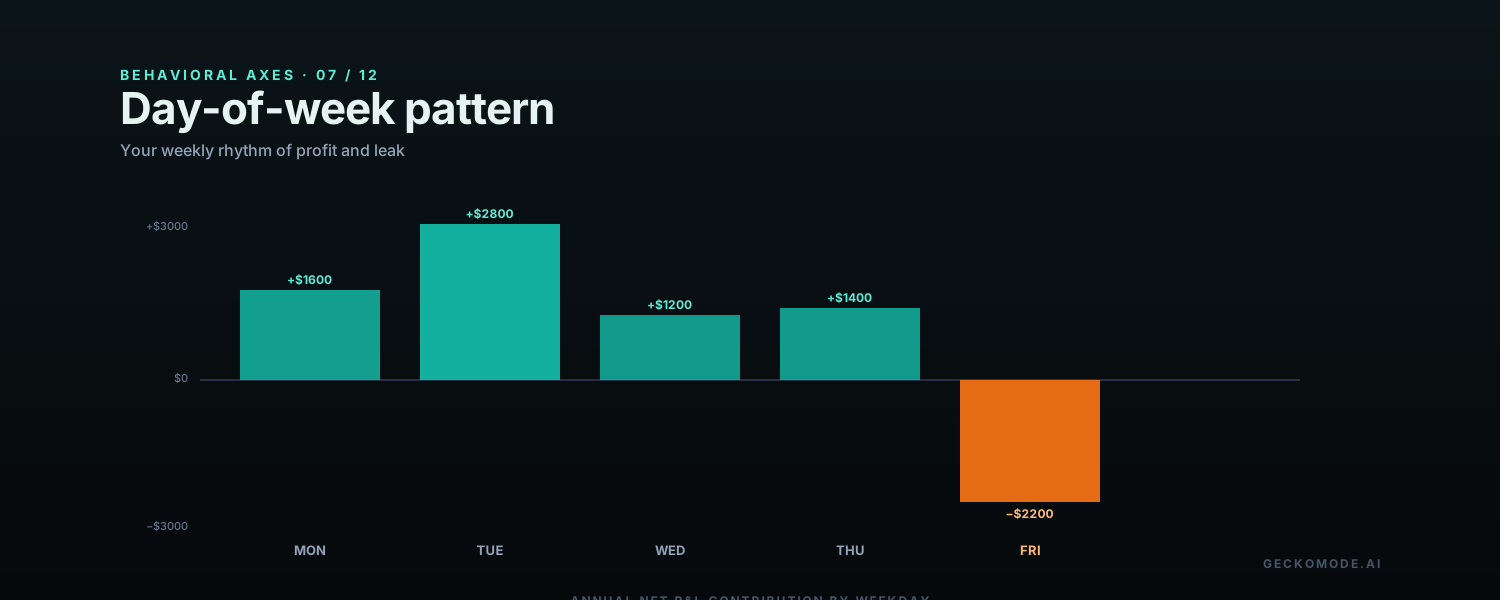
The trading week is not seven equal blocks. For most traders, two days are reliably profitable, two are reliably the opposite, and the rest are noise. The day-of-week pattern axis surfaces that structure directly from the trader’s own data, in dollars, so the weekly calendar stops being an undifferentiated grid and starts being a map of where the account is actually made and lost.
Why every trader has a personal weekday shape
The market has structural weekday biases (Monday gap-fills, Wednesday inventory cycles in oil, Friday options expiration, end-of-week positioning) but those biases live on top of an even bigger source of variance: the trader. Energy, focus, life schedule, and even commute timing all produce a weekly rhythm in trading performance that the trader can feel but rarely measures.
The result is a quietly persistent leak: the same trader who has a +0.7 R Tuesday year after year also has a −0.4 R Friday year after year, and never adjusts their schedule to reflect that. Half a year of Fridays gives back the entire edge of Tuesdays.
The fingerprint in your trade data
| Pattern in the data | What it means |
|---|---|
| Net P&L by day-of-week shows a consistent best and worst day | The trader has a real weekly rhythm in execution quality. |
| Trade count is spread evenly across the week but P&L isn’t | Allocation is uniform; outcomes are not. The trader is paying to be active on their bad days. |
| Win rate drops on a specific day across multiple months | A structural day-of-week leak, not a one-off bad week. |
| Friday afternoon trades show outsized losses | End-of-week fatigue plus position-flat pressure is showing up as bad selection. |
The math: a leaky day compounds across a year
Take a trader with 100 trading days a year evenly split: 20 per weekday. Net per-day P&L by weekday: Monday +$80, Tuesday +$140, Wednesday +$60, Thursday +$70, Friday −$110. Annual contribution: Monday +$1,600, Tuesday +$2,800, Wednesday +$1,200, Thursday +$1,400, Friday −$2,200. Total $4,800. Removing Friday from the schedule turns it into $7,000 on the same setups and roughly 20 percent less trading time. The trader did not learn anything new. They stopped trading the day their own data said to skip.
How Gecko measures it
The day-of-week-pattern axis bins every closed trade by the day of the week of its exit, then reports:
- Net P&L per day-of-week, with the rolling six-month and rolling twelve-month versions side by side so the trader sees both the recent shape and the durable one.
- Win rate and average R per day-of-week, flagging gaps larger than the noise band.
- Trade count per day, surfaced as a contrast against P&L so the trader sees whether they are over- or under-allocating effort.
A worked example
A swing trader uploads thirteen months of activity. The monthly cut shows random-looking week-to-week noise. The day-of-week cut shows Tuesday and Wednesday accounting for 160 percent of net P&L; Monday and Thursday roughly break even; Friday is the only consistently negative day, accounting for −60 percent of net P&L by itself. The trader had been telling themselves they were a five-day trader; the data showed they were a two-day trader paying a Friday tax. Cutting Friday alone changed the trajectory of the next quarter.
The fix: align the calendar to the data
The day-of-week axis is the easiest to act on because the rule is binary per day. The trader picks the days, writes them down, and stops opening the platform outside them:
- Trade only days that show a consistent positive contribution over the last six months. Two months is too short; six is statistically defensible.
- On days that are flagged neutral, trade only the very highest-quality setups. The bar is higher; volume is lower.
- Skip the days that are flagged negative entirely. The revenue forgone is smaller than the revenue saved.
- Re-grade quarterly. The shape drifts; the rule should drift with it.
What to read next
The companion axis is time-of-day skew — same logic, finer resolution. The Qullamaggie profile is the cleanest single piece on running a tight personal schedule against the market’s noisy one.
Map your weekday shape →Free to start. First 100 trades on the house. No broker connection required.
Drop in a single statement. Gecko produces a one-page Behavioral Diagnosis ranking your costliest habits in actual dollars. Free to start. No card. No broker connection.
Short notes, usually once or twice a month. Unsubscribe in one click.
No account needed. We use your email only to send Gecko blog posts, and the link at the bottom of every email opts you out in one click.
More on the blog
- The AI Debt Machine: Circular Financing, Off-Balance-Sheet Data Centers, and the Ghosts of Bubbles PastThe AI build-out has quietly shifted from cash to debt: hyperscaler bonds near $194 billion in 2026, private credit's share of AI financing up from about 9% to 34%, debt parked in off-balance-sheet vehicles, and a circular loop among Nvidia, OpenAI, Oracle and CoreWeave. What telecom, Enron and the 1920s say about it, and what a trader should actually do.
- When the Consumer BreaksHousehold debt booms have a long record of ending in slowdowns that forecasters miss. What that history says about markets, and about the most overlooked balance sheet in trading: your own.
- How Banking Crises Actually StartThe run is the last chapter, not the first. What 150 years of bank failures teach traders about reading stress, and about the mistakes made when the headlines finally arrive.