Revenge Re-entry: Same Instrument, Ninety Seconds Later
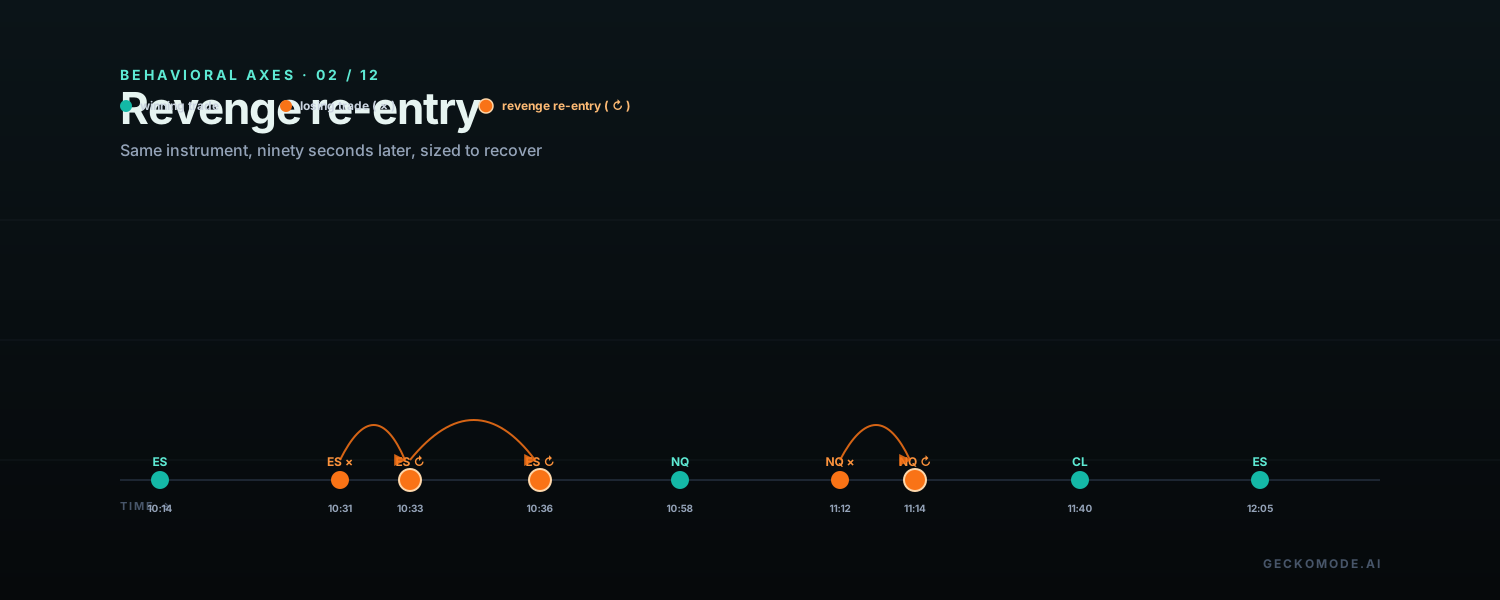
Every trader has done it. The stop hits, the loss closes, and within ninety seconds the chart for the same instrument is back on the screen, the order ticket is open, and a new position is on. Not because the setup just printed again. Because the market took dollars and the trader wants them back. This is revenge re-entry: the narrower, sharper cousin of after-loss tilt, and the single axis on Gecko’s diagnosis that is easiest to see in trade data because the fingerprint is so specific.
Tilt versus revenge
Tilt is a state. Revenge re-entry is a sentence: the trader sells a losing position at 10:43 and buys the same instrument at 10:45. Tilt could be expressed in any instrument, any direction, any size; revenge re-entry is almost always the same instrument and the same direction as the loss. The trader is not evaluating a setup. They are answering a debt the market does not actually recognize.
The reason this distinction matters is operational. Tilt responds to a wait-time rule across all trades. Revenge re-entry responds to a same-instrument cooldown. Both rules can run at the same time and target different mechanisms.
The fingerprint in your trade data
| Pattern in the row | What it means |
|---|---|
| Same instrument as the prior closing trade | The trader is hunting the dollars they just lost, not the next-best setup. |
| Re-entered within minutes (typically <5) | The decision was made before the emotional half-life of the loss expired. |
| Same or larger size than the losing trade | The trader is sizing to recover the dollar amount, not by setup quality. |
| Win rate on revenge re-entries is materially worse than the baseline | The trader is not seeing an edge; the market has not changed; only the trader has. |
Single occurrences are noise. The axis only fires when the pattern is statistically present across a meaningful number of post-loss closes.
The math: why this axis is so visible
Revenge re-entry concentrates losses in a way that almost every other axis disperses. A trader who takes one revenge re-entry a week, sized 1.5 times normal, with a win rate twenty points below baseline, is creating a small number of large negative outliers that drag the entire equity curve. Those outliers are also the most psychologically corrosive trades the account produces: they confirm that losses are recoverable through action, and they reinforce the next attempt.
The compounding aspect is what makes revenge re-entry the axis Gecko ranks highest by dollars-per-occurrence across most accounts. Tilt costs more in aggregate (more trades affected); revenge re-entry costs more per incident.
How Gecko measures it
For every closing loss, Gecko looks forward in the trade stream for any new entry into the same instrument within a defined window (default five minutes). When such an entry exists, that entry is tagged as a revenge re-entry. The axis then computes three things over the tagged subset:
- The percentage of total trades that are revenge re-entries.
- The average position size on revenge re-entries versus the trader’s rolling-median size.
- The net P&L per revenge re-entry trade, expressed in dollars and in R-multiples.
As with every Gecko axis, the score is gated by a sample- size requirement so the diagnosis refuses to be confidently wrong on a small handful of trades.
A worked example
A futures trader uploads three months of activity. The diagnosis shows a 49 percent win rate and an expectancy of plus 0.2 R per trade. Inside that sample, Gecko isolates 24 revenge re-entries (5 percent of the total). The average size on those trades is 1.6 times the trader’s normal size. Win rate on the subset is 29 percent. Net P&L on the subset is minus 18.4 R. The trader’s account produced a positive expectancy across the full sample, and was meaningfully positive once the revenge subset was removed. The single axis decided a year of work.
The fix is a same-instrument cooldown
The rule with the cleanest measured effect is also the simplest: after any loss, no re-entry into the same instrument for at least N minutes. Fifteen is a defensible default; the trader tunes higher if their personal revenge window is longer.
The mechanic that makes the rule survive contact with the next market is making the cooldown happen at the order ticket, not in the trader’s head:
- Set a kitchen timer on stop-out. The timer being visible beats “I’ll wait a few minutes”.
- Switch instruments for the window. If the trader wants to trade, they can take any setup that is not the same instrument they just lost in.
- Log the loss in the journal before considering any new entry. Writing is itself a delay and a context shift.
- Pre-commit to closing the platform on the third consecutive stop-out in the same instrument. The third attempt is almost never the highest-edge trade available.
What to read next
The natural pair to this post is the one on after-loss tilt, which covers the broader emotional state revenge re-entry sits inside. Mackay’s account of crowd psychology is the long-form version of the same lesson applied to markets. The glossary entry is the one-paragraph reference.
Find your revenge trades →Free to start. First 100 trades on the house. No broker connection required.
Drop in a single statement. Gecko produces a one-page Behavioral Diagnosis ranking your costliest habits in actual dollars. Free to start. No card. No broker connection.
Short notes, usually once or twice a month. Unsubscribe in one click.
No account needed. We use your email only to send Gecko blog posts, and the link at the bottom of every email opts you out in one click.
More on the blog
- The AI Debt Machine: Circular Financing, Off-Balance-Sheet Data Centers, and the Ghosts of Bubbles PastThe AI build-out has quietly shifted from cash to debt: hyperscaler bonds near $194 billion in 2026, private credit's share of AI financing up from about 9% to 34%, debt parked in off-balance-sheet vehicles, and a circular loop among Nvidia, OpenAI, Oracle and CoreWeave. What telecom, Enron and the 1920s say about it, and what a trader should actually do.
- When the Consumer BreaksHousehold debt booms have a long record of ending in slowdowns that forecasters miss. What that history says about markets, and about the most overlooked balance sheet in trading: your own.
- How Banking Crises Actually StartThe run is the last chapter, not the first. What 150 years of bank failures teach traders about reading stress, and about the mistakes made when the headlines finally arrive.