Hold-Time Discipline: Winners Short, Losers Long
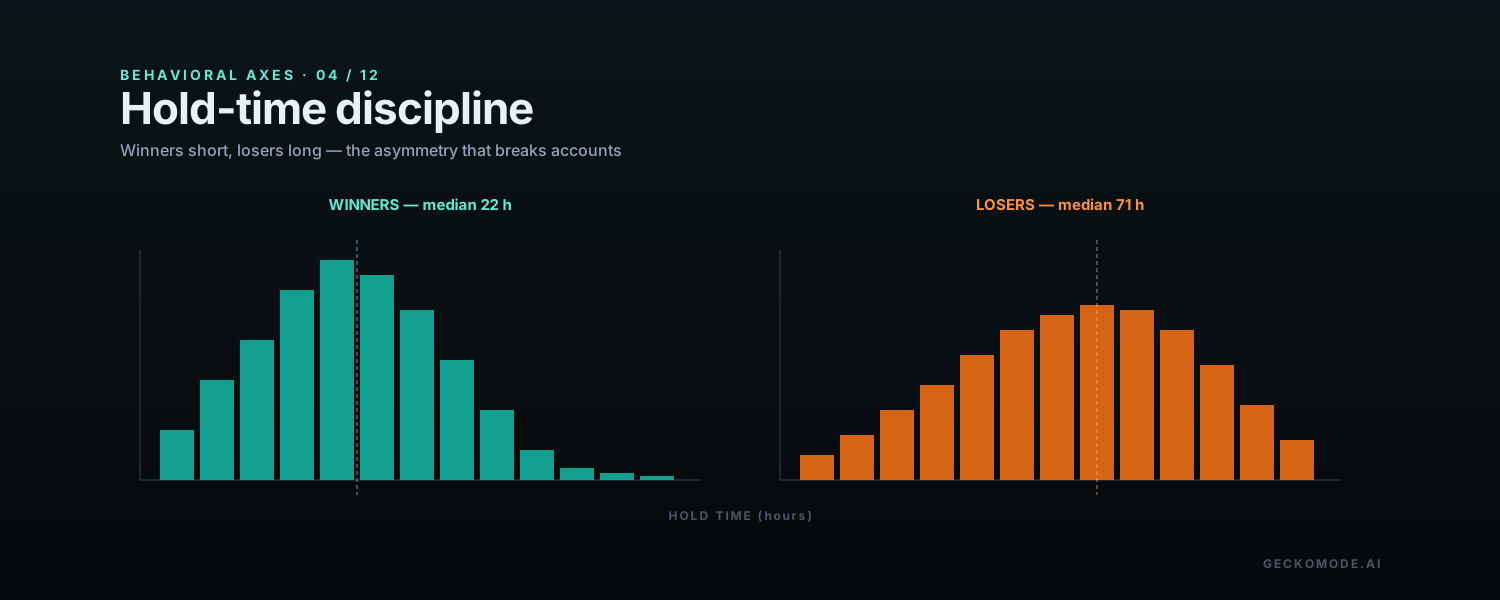
The most expensive habit in trading does not look like a habit. It looks like prudence. The trader closes a winner at plus two-thirds of the target because the gain feels like enough; they hold a loser past the stop because closing it would make the loss official. Both decisions feel reasonable in the moment. Together they invert the only ratio that actually matters. Hold-time discipline is the axis Gecko uses to surface that inversion in dollars.
The asymmetry that breaks accounts
A profitable strategy can be a losing account if the average winner is held shorter than the average loser. The math is simple: a strategy with a fifty percent win rate and a one-to-one planned reward-to-risk ratio has a real expectancy of zero only if winners and losers are symmetric. Tilt the winner-to-loser hold time ratio in either direction and the same setup produces a different equity curve.
Behavioral finance has a long name for the underlying force: loss aversion. The pain of a dollar lost is approximately twice the pleasure of a dollar gained, which means a winner becomes psychologically valuable the moment it goes green (lock it in!) and a loser becomes psychologically defended the moment it goes red (just wait, it’ll come back). The result on the trade tape is identical regardless of style or market: winners short, losers long.
The fingerprint in your trade data
| Pattern in the data | What it means |
|---|---|
| Median hold-time for losers is materially longer than for winners | The classic loss-aversion signature; the trader is closing winners on emotion and defending losers on hope. |
| MFE-capture ratio is well below 1 | The average trade is realizing far less than the available gain ( MFE) it touched at some point. |
| Stops are widened mid-trade with no rule-based trigger | Losers are being kept alive past their planned stop, the most reliable predictor of long-run ruin. |
| Average winner R is smaller than average loser R | The trade tape says the trader is taking smaller wins than the losses they accept. |
The math: why a small asymmetry compounds
Suppose a trader’s setup has a true edge: 50 percent win rate, planned 2R winners and 1R losers. Expected per-trade value = 0.5 × 2R − 0.5 × 1R = +0.5R. Strong.
Now introduce a small asymmetry: actual winners average 1.4R (cut early) and actual losers average 1.2R (held late). Same setup, same win rate. Expected per-trade value drops to 0.5 × 1.4R − 0.5 × 1.2R = +0.1R, a fifth of the edge the setup was designed to deliver. The trader has not changed their strategy. They have changed the part of the strategy that survives execution.
Push the asymmetry a little further (1.2R winners, 1.5R losers) and the expectancy turns negative. The trader is now running a winning strategy as a losing trader.
How Gecko measures it
Gecko’s hold-time-discipline axis compares the distribution of hold times for winners and losers, then compares the realized R-multiples to planned R-multiples for each. The axis surfaces three numbers:
- Median hold time of winners vs losers, with the asymmetry expressed as a ratio.
- MFE-capture ratio: realized winner P&L divided by the trade’s peak unrealized gain. Above 0.75 is healthy; below 0.5 is a leak.
- Realized average R-multiple for winners vs losers, with the gap from planned R flagged.
A worked example
A swing trader uploads 220 closed trades. Median winner hold time is 22 hours. Median loser hold time is 71 hours. MFE-capture ratio is 0.41. Realized winner R is +1.1; the plan said +2.5. Realized loser R is −1.4; the plan said −1.0.
The diagnosis is unambiguous. Setup quality is not the problem; the trader picks setups that produce real movement (MFE proves it). The execution loses 60 percent of the available gain by exiting early, and amplifies every loss by 40 percent by holding past the stop. The single highest-dollar fix in this account is not a better screen. It is honoring the targets and stops that the setup was designed around.
The fix: pre-committed targets and trailing stops
Hold-time discipline responds to bracket orders the way tilt responds to a kitchen timer: structurally. The techniques that survive contact with the next trade are the ones that take the decision out of the moment:
- Bracket every trade at entry. Take-profit and stop go in the broker before the trader gets emotionally invested in the position.
- Move stops only in the direction of the trade. Trailing stops by rule, never by feeling.
- Use partial exits, not whole-position discretion. If the urge to lock in is strong, sell a third at +1R, let two thirds run to plan. The math is far better than full- position early exits.
- Review winners as carefully as losers in the journal. The high-MFE winner you closed at +50 percent of target is a more expensive lesson than the small loss that hit the planned stop.
What to read next
The deepest treatment of the asymmetry problem from a trader’s perspective is the Druckenmiller profile — accuracy is not the scoreboard, magnitude is. The Ed Seykota profile is the trend-follower’s version of the same lesson. The glossary entry is the one-paragraph reference.
See your hold-time asymmetry →Free to start. First 100 trades on the house. No broker connection required.
Drop in a single statement. Gecko produces a one-page Behavioral Diagnosis ranking your costliest habits in actual dollars. Free to start. No card. No broker connection.
Short notes, usually once or twice a month. Unsubscribe in one click.
No account needed. We use your email only to send Gecko blog posts, and the link at the bottom of every email opts you out in one click.
More on the blog
- The AI Debt Machine: Circular Financing, Off-Balance-Sheet Data Centers, and the Ghosts of Bubbles PastThe AI build-out has quietly shifted from cash to debt: hyperscaler bonds near $194 billion in 2026, private credit's share of AI financing up from about 9% to 34%, debt parked in off-balance-sheet vehicles, and a circular loop among Nvidia, OpenAI, Oracle and CoreWeave. What telecom, Enron and the 1920s say about it, and what a trader should actually do.
- When the Consumer BreaksHousehold debt booms have a long record of ending in slowdowns that forecasters miss. What that history says about markets, and about the most overlooked balance sheet in trading: your own.
- How Banking Crises Actually StartThe run is the last chapter, not the first. What 150 years of bank failures teach traders about reading stress, and about the mistakes made when the headlines finally arrive.