Size Discipline: The Spread That Says Rule or Emotion Is in Charge
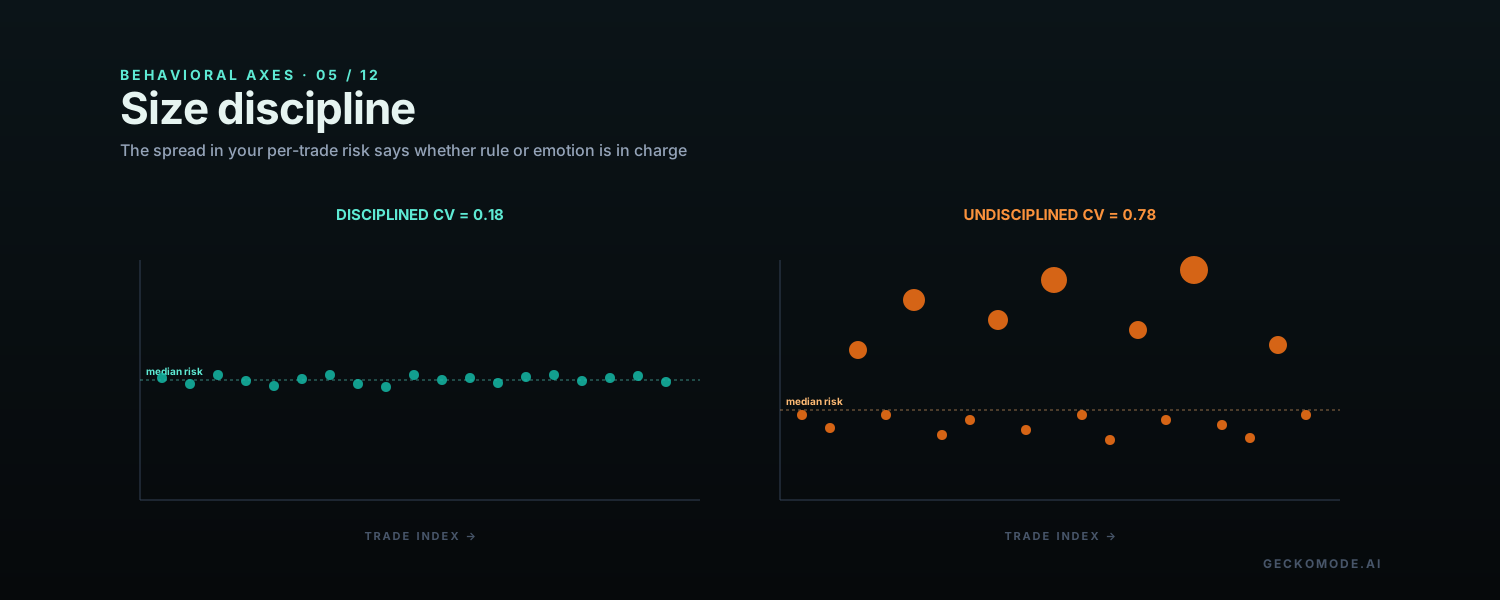
Two traders with identical setups and identical win rates can produce wildly different equity curves based purely on how they size, and the sizing decision is the one the trader fully controls. The math is uncompromising: the spread in a trader’s per-trade risk is one of the cleanest predictors of long-term drawdown and one of the most reliable signals that risk is being set by emotion rather than by rule. Size discipline is how Gecko measures it.
Why size variance is a behavioral signal, not a strategy choice
A trader on a rule-based position-sizing scheme (a fixed-fractional 1 percent of equity, say) will show a tight, narrow distribution of per-trade risk in dollars. The risk drifts gently as the account compounds; it does not jump on consecutive trades. A trader sizing by feeling will show a wide, lumpy distribution: small risk on the trades they doubt, large risk on the trades they like, outsized risk on the trades they take in revenge. The distribution shape itself is the diagnosis.
The reason this matters is that the strategy never asked for the variance. The variance is the trader’s emotion overriding the position-sizing rule. Every oversized trade increases the contribution of a single outcome to total P&L; every undersized one mutes a real signal. Both push the account further from the expectancy the strategy was supposed to deliver.
The fingerprint in your trade data
| Pattern in the data | What it means |
|---|---|
| Coefficient of variation in per-trade risk > 0.5 | Sizing is wide enough that emotion is in the loop. A disciplined fixed-fraction account runs <0.2. |
| Size on the largest trade is >3× the median | One swing trade carries disproportionate P&L weight; outcomes are concentrating. |
| Size correlates positively with recent losses | The trader is escalating risk to recover, the classic gambler’s fallacy pattern. |
| Size correlates positively with recent wins | The trader is pressing on streaks; an oversized loss inside a streak gives back a disproportionate share of the gains. |
The math: a small sizing leak can erase a good strategy
Suppose a strategy has true expectancy of +0.5R per trade and the trader runs a disciplined 1 percent fixed-fraction sizing scheme. Over 100 trades the expected return is roughly 50 percent (in R, scaled to risk-per-trade), with a tight, modelable drawdown distribution.
Now introduce one behavioral leak: the trader sizes 3 percent on revenge trades, which make up 5 percent of total volume. The math: 95 trades at 1 percent and 5 trades at 3 percent, with the 5 revenge trades running a far worse win rate. The expected return drops; the variance of the equity curve roughly doubles; the modeled risk of ruin at any given drawdown threshold rises sharply. The trader did not change strategy or markets. They changed sizing on 5 percent of trades. The account no longer looks like the same account.
How Gecko measures it
The size-discipline axis computes the trader’s per-trade dollar risk (entry minus stop times size), then reports:
- The distribution’s coefficient of variation (CV = standard deviation ÷ median). Lower is more disciplined.
- The size ratio of the largest 10 percent of trades to the median, flagged when above 2.5×.
- The correlation between trade size and prior-trade outcome, flagged when significantly different from zero.
The axis is most useful as a coaching signal: it does not prescribe a sizing scheme, it grades whatever the trader is doing against its own internal consistency.
A worked example
A futures trader uploads 180 closed trades. Median per-trade risk is $250. CV is 0.78. The largest 10 percent of trades risk $850 on average (3.4× median). Correlation between size and prior-trade loss is +0.34 (positive, statistically significant). The diagnosis writes itself: the strategy is being layered with an unwritten rule that says “size up after a loss to recover.” That rule, never written down, is what the equity curve is actually executing — and it is the rule responsible for the trader’s deepest drawdowns of the year.
The fix: write the sizing rule down, and run it
Size discipline does not respond to good intentions. It responds to a written sizing rule applied with the same mechanical reliability as a stop-loss order:
- Pick one sizing scheme and stick to it. Fixed-fractional (1 percent of equity) is the most defensible default; volatility-adjusted variants build on the same idea.
- Compute the trade size in writing before each entry, ideally automated by a calculator that takes equity, stop distance, and risk-percent as inputs.
- Refuse any size override that is not itself a documented sizing rule. The lifetime cost of a disciplined size that turns out to be a winner is much smaller than the lifetime cost of an undisciplined size that turns out to be a loser.
- Audit the per-trade risk distribution monthly. CV that drifts higher is an early warning sign that the rule is being eroded.
What to read next
The cleanest piece on the dollar weight of sizing decisions in a career is the Paul Tudor Jones profile — defense first, size by rule, never average a loser. The Peter Brandt profile is the half-century version of the same discipline. The glossary entry is the one-paragraph reference.
Grade your sizing →Free to start. First 100 trades on the house. No broker connection required.
Drop in a single statement. Gecko produces a one-page Behavioral Diagnosis ranking your costliest habits in actual dollars. Free to start. No card. No broker connection.
Short notes, usually once or twice a month. Unsubscribe in one click.
No account needed. We use your email only to send Gecko blog posts, and the link at the bottom of every email opts you out in one click.
More on the blog
- The AI Debt Machine: Circular Financing, Off-Balance-Sheet Data Centers, and the Ghosts of Bubbles PastThe AI build-out has quietly shifted from cash to debt: hyperscaler bonds near $194 billion in 2026, private credit's share of AI financing up from about 9% to 34%, debt parked in off-balance-sheet vehicles, and a circular loop among Nvidia, OpenAI, Oracle and CoreWeave. What telecom, Enron and the 1920s say about it, and what a trader should actually do.
- When the Consumer BreaksHousehold debt booms have a long record of ending in slowdowns that forecasters miss. What that history says about markets, and about the most overlooked balance sheet in trading: your own.
- How Banking Crises Actually StartThe run is the last chapter, not the first. What 150 years of bank failures teach traders about reading stress, and about the mistakes made when the headlines finally arrive.