Long vs Short Asymmetry: Which Side Carries Your Book
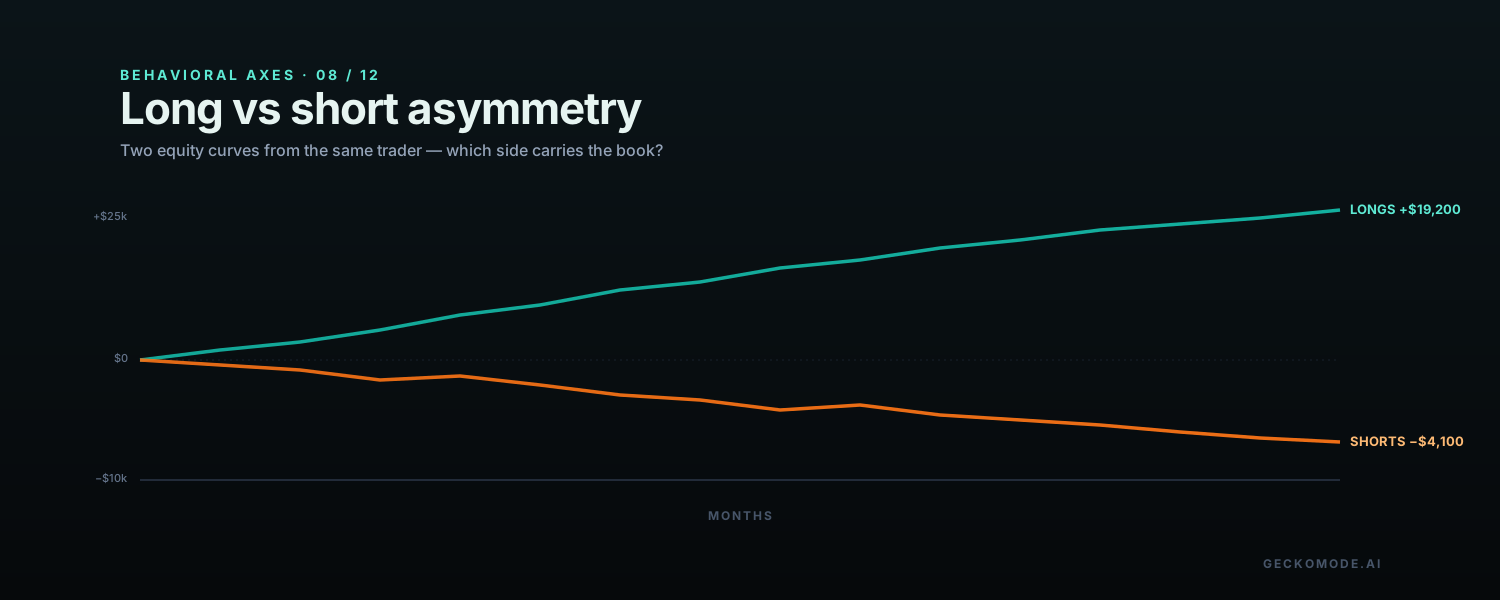
Almost no trader is symmetric. The same person who runs a positive expectancy on the long side will routinely run a negative one on the short side, and never see it because their P&L statement does not slice that way. Long-short asymmetry is the Gecko axis that compares the two halves of the trader’s book side by side, in dollars, and names the imbalance directly. The fix is usually not learning to short better. It is learning to short less, or not at all.
Why long and short are different problems
Going long has been the default trade for centuries, with cultural, structural, and psychological tailwinds: the market has an upward drift, the long position has bounded downside (the stock cannot go below zero) and unbounded upside, dividends accrue to the holder, and the trader does not have to feel like they are betting against something. Going short reverses every one of those comforts. The upside is bounded, the downside is unbounded, the trader pays dividends and carry, and the position moves against the market’s long-run drift.
None of this means short selling is bad; great traders are often great precisely because they can take the side most people refuse to. But it does mean short trades require a different discipline, and a trader without that discipline will routinely underperform their long book without realizing it.
The fingerprint in your trade data
| Pattern in the data | What it means |
|---|---|
| Win rate on shorts is materially worse than longs | Selection on the short side is degraded; the trader takes shorts that would not have passed the long-side bar. |
| Average loser size is larger on shorts than longs | Stop discipline is weaker on shorts because the unbounded-upside math feels less concrete than the bounded-downside math of a long. |
| Volume is dominated by one side | The trader is effectively a long-only or short-only trader by frequency, even if both sides appear in the book. |
| Net P&L attributable to the minority side is negative | The minority side is a small but durable leak; eliminating it raises overall expectancy. |
The math: one-sided edge is the common case
Many strong traders are profitable on the long side and roughly breakeven (or slightly negative) on the short side. That is not a moral problem; it is a measurement problem that becomes a decision problem. A trader who runs +0.5 R long and −0.2 R short, with 70 percent of trades long, has an overall expectancy of 0.7 × 0.5 + 0.3 × (−0.2) = +0.29 R. Cutting the short side entirely produces 1.0 × 0.5 = +0.5 R with no improvement in setup quality and a reduction in trade count. Same trader, no new strategy, 70 percent higher expectancy.
For the trader whose short side is positive but worse than their long side, the fix is calibration rather than elimination: a tighter setup bar for shorts, smaller default size, and a faster stop. The data tells the trader which version of the conversation to have with themselves.
How Gecko measures it
The long-short asymmetry axis splits the closed-trade sample by direction and computes per-side:
- Win rate, average winner R, average loser R, and expectancy per trade.
- Net P&L contribution as a percentage of total, with the trade count as a contrast.
- The relative size of typical winners and losers across sides, surfaced when the asymmetry is statistically meaningful.
A worked example
A discretionary equities trader uploads two years of activity covering 410 closed trades. Sliced by direction: long trades number 280 and contribute +$19,200; short trades number 130 and contribute −$4,100. Short win rate is 38 percent versus 56 percent for longs. Average short loser is 1.35 R versus 1.0 R on longs. The trader was proud of being a “two-sided trader”; their data says they are a long-only trader who has been taxing themselves with shorts for two years. Cutting the short book entirely would have raised the account by roughly $4,100 with strictly less work.
The fix: trade the side where your edge is real
The action item depends on what the data says:
- If one side is materially negative across a meaningful sample, stop trading it. Revisit only with a written process change and a fresh sample to validate.
- If one side is positive but worse, raise the bar. Smaller default size, tighter setup criteria, faster stops. Treat it as the more difficult half of the book that it is.
- Tag every trade by direction in the journal. The trader who looks at their long and short P&L separately every week catches drift early.
- Audit the imbalance quarterly. The shape changes with the market regime; the rule should follow.
What to read next
The cleanest piece on betting hard on the side where edge is real is the Druckenmiller profile — accuracy is not the scoreboard, magnitude is. The Peter Brandt profile covers the discipline of trading one’s own book honestly over decades.
Check your two-sided book →Free to start. First 100 trades on the house. No broker connection required.
Drop in a single statement. Gecko produces a one-page Behavioral Diagnosis ranking your costliest habits in actual dollars. Free to start. No card. No broker connection.
Short notes, usually once or twice a month. Unsubscribe in one click.
No account needed. We use your email only to send Gecko blog posts, and the link at the bottom of every email opts you out in one click.
More on the blog
- The AI Debt Machine: Circular Financing, Off-Balance-Sheet Data Centers, and the Ghosts of Bubbles PastThe AI build-out has quietly shifted from cash to debt: hyperscaler bonds near $194 billion in 2026, private credit's share of AI financing up from about 9% to 34%, debt parked in off-balance-sheet vehicles, and a circular loop among Nvidia, OpenAI, Oracle and CoreWeave. What telecom, Enron and the 1920s say about it, and what a trader should actually do.
- When the Consumer BreaksHousehold debt booms have a long record of ending in slowdowns that forecasters miss. What that history says about markets, and about the most overlooked balance sheet in trading: your own.
- How Banking Crises Actually StartThe run is the last chapter, not the first. What 150 years of bank failures teach traders about reading stress, and about the mistakes made when the headlines finally arrive.